


13
May
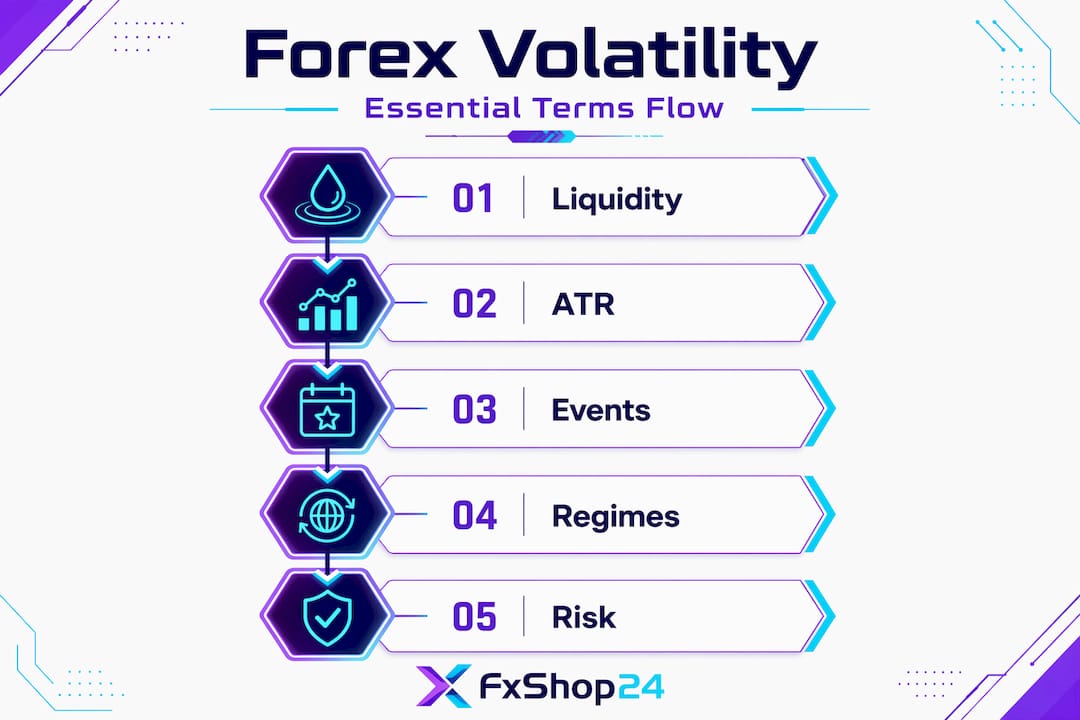
Forex market volatility: Boost strategies and manage risk
TL;DR:
- Market volatility in forex reflects the speed and magnitude of currency price changes, not chaos. Traders who interpret it accurately gain an edge by adjusting risk measures, position sizes, and strategy parameters accordingly. Recognizing the dynamic nature of volatility across regimes and events is crucial for sustainable trading success.
Most retail traders hear the word “volatility” and instinctively brace for losses. That reaction is understandable, but it’s also one of the most costly misconceptions in forex trading. Volatility is not market chaos. It’s market information, and traders who learn to read it correctly gain a measurable edge over those who simply fear it. In this guide, we break down what forex market volatility actually means, how to measure it with real tools, why it shifts constantly across regimes and events, and how to turn those insights into smarter position sizing, stop placement, and automated strategy design.
Table of Contents
- What is forex market volatility?
- The main ways to measure forex volatility
- Volatility is not constant: Regimes, events, and why it matters
- Historical vs implied volatility: What traders must know
- Applying volatility insights: Smarter trading strategies
- Why treating volatility as a living risk variable gives traders an edge
- Enhance your trading with volatility-aware automation
- Frequently asked questions
Key Takeaways
| Point | Details |
|---|---|
| Volatility defined | Volatility describes how much and how quickly forex prices move, impacting both risk and reward. |
| Measurement matters | Tools like ATR and Garman-Klass allow you to quantify volatility for smarter trading decisions. |
| Volatility shifts | Market events and changing regimes cause volatility to rise and fall, affecting strategy outcomes. |
| Historical vs implied | Realized volatility looks backward at price moves, while implied volatility anticipates future risks. |
| Strategy adaptation | Traders who adapt position sizing and tactics to volatility can reduce risk and spot new opportunities. |
What is forex market volatility?
Before you can use volatility, you need to understand it at a level that goes beyond “prices moving a lot.” Forex market volatility refers to how much and how quickly currency prices change over time. It can be quantified either by historical (realized) price movement or by implied expectations derived from derivatives and options pricing. In plain terms, it measures both the size and the speed of price changes in a currency pair.
Understanding volatility matters for two reasons: risk control and opportunity identification. In low-volatility conditions, your stops can be tighter and your lot sizes potentially larger without overexposing your account. In high-volatility conditions, the reverse applies. Every parameter in your trading plan needs to reflect the current market environment, not a static assumption you set up six months ago.
Here are the core forms of volatility you need to know:
- Historical (realized) volatility: Computed from actual past price data. It tells you what the market has done.
- Implied volatility: Derived from option prices. It reflects what the market expects to do going forward.
- Intraday volatility: How much a pair moves within a single trading session, often spiking around news events.
- Structural volatility: The baseline choppiness of a currency pair due to its liquidity profile and underlying economy.
A key conceptual distinction every serious trader must internalize is this: realized volatility is computed from observed returns, while implied volatility is the level that derivatives markets are pricing in, derived from option prices via an option-pricing model. Conflating the two leads to real mistakes in risk sizing and strategy selection.
“If you only look backward, you only see what already happened. Implied volatility lets you glimpse what the market is afraid of next.”
Understanding forex trading terminology around volatility also pairs tightly with concepts like forex liquidity, because the two forces are deeply interconnected. Low liquidity often amplifies volatility, especially during off-hours or around major data releases.
The main ways to measure forex volatility
Once you understand what volatility is, the next step is learning how to measure it effectively for your trading toolbox. Not all measurement methods are created equal. Choosing the wrong one for your trading style can lead to misaligned stop-losses, poor lot sizing, and systems that fail in live markets despite strong backtests.
A practical way retail traders measure realized volatility in FX is using the Average True Range (ATR). ATR captures typical price movement over a lookback window and expresses results in the instrument’s price units, which in forex means pips. It’s simple, widely available on every trading platform, and immediately actionable.

For those running quantitative systems, range-based estimators like Garman-Klass (GK) use open, high, low, and close data to estimate daily volatility more efficiently than simple close-to-close methods. This means you get a statistically cleaner signal from the same amount of data.
Here’s a comparison of the three most common methods:
| Method | Inputs used | Sensitivity | Typical use case |
|---|---|---|---|
| ATR | High, low, close | Moderate | Stop-loss sizing, breakout filters |
| Close-to-close | Close prices only | Lower | Quick daily estimates |
| Garman-Klass | Open, high, low, close | Higher | Quantitative systems, algo calibration |
How to apply ATR for stop-loss placement, step by step:
- Add the ATR indicator to your MT4 or MT5 chart with a 14-period lookback.
- Read the current ATR value in pips for your selected currency pair.
- Multiply ATR by 1.5 to 2.0 to get a stop-loss distance that reflects normal market breathing room.
- Update this calculation at the start of each session or after major news events.
- Adjust your lot size so that hitting the stop does not exceed your per-trade risk percentage (typically 1-2% of account balance).
Pro Tip: Garman-Klass volatility estimates are statistically more efficient than close-to-close in fast-moving markets. If you’re building an EA (expert advisor) or quantitative model, consider integrating GK as your primary volatility input instead of relying solely on ATR. It extracts more signal from the same price data.
Volatility is not constant: Regimes, events, and why it matters
Understanding measurement is a start, but volatility is a moving target shaped by global events and market regimes. Failing to account for this is one of the biggest reasons automated strategies that perform brilliantly on backtests underperform in live conditions.
Volatility in FX is strongly regime-dependent, meaning the same strategy may face entirely different volatility distributions across sessions and news periods. A scalping system that works flawlessly during the quiet Tokyo session can blow its risk parameters wide open during a surprise Federal Reserve announcement in the New York session.
Here’s a quick comparison of what changes between calm and stressed market regimes:
| Feature | Calm regime | Stressed regime |
|---|---|---|
| Typical pip range (daily) | 40-80 pips | 150-300+ pips |
| Bid-ask spreads | Tight | Significantly wider |
| Liquidity depth | High | Thin, patchy |
| Slippage risk | Low | High |
| Recommended lot size | Standard | Reduced |
| Stop-loss distance | Closer | Wider |
Real-world events that have driven extreme FX volatility include:
- NFP (Non-Farm Payrolls) releases: The US monthly jobs report routinely moves major pairs 50-150 pips in seconds.
- Central bank rate decisions: Surprise hikes or cuts from the Fed, ECB, or Bank of England can move EUR/USD or GBP/USD by 200+ pips in a single candle.
- Flash crashes: The January 2019 USD/JPY flash crash saw the pair drop nearly 400 pips in minutes, driven by thin liquidity during the Asian session.
- Geopolitical shocks: Military conflicts or political crises can trigger sustained multi-day volatility spikes in commodity-linked currencies.
- Brexit announcements: The GBP saw several extreme volatility events during the 2016-2019 period that caught many automated systems completely off guard.
You can study some of these regime-level shocks by reviewing major market events that illustrate how quickly conditions can change. External drivers of currency moves are equally worth understanding, because the underlying fundamentals explain why certain events trigger bigger volatility spikes than others.
Key takeaway: Liquidity shrinkage during market stress is one of the strongest amplifiers of volatility. Fewer market makers and wider spreads mean that the same order flow creates much larger price swings. This is why you must plan your systems around volatility regimes, not just average market conditions.
Historical vs implied volatility: What traders must know
To round out your working knowledge, let’s tackle how historical and forward-looking implied volatility offer distinct risk signals for active traders.
The realized vs implied distinction is this: realized volatility is computed from observed price returns, while implied volatility is the level that derivatives markets are pricing in, derived from option prices via an option-pricing model. One is a rearview mirror; the other is a windshield.
Here’s why this matters practically:
- Realized volatility is backward-looking. It tells you how much a pair actually moved. Useful for calibrating stops and position sizes based on recent behavior.
- Implied volatility is forward-looking. It encodes the market’s collective expectation of future price swings. When implied volatility is much higher than realized volatility, the options market is signaling elevated risk ahead.
- Implied volatility captures event and tail-risk premium. Before major economic events, implied volatility typically spikes even when recent price action has been calm. This is the market pricing in the unknown.
- Automated strategies relying only on realized volatility can underestimate live risk. If your EA sizes positions based on the last 14 days of calm price action, but the options market is pricing in a Fed decision tomorrow, your system is exposed to a risk it hasn’t accounted for.
Pro Tip: During high-impact news events, always check implied volatility signals from the options market before running your EA at full capacity. If implied volatility is running significantly above realized volatility, reduce your position sizes or pause trading entirely until the event passes. This one habit alone can protect your account from outsized drawdowns.
Applying volatility insights: Smarter trading strategies
You now know what volatility is, how to measure it, and what influences it. Here’s how to make it work for your actual trading goals, whether you trade manually or through automated systems.
Treating volatility as a state variable rather than a fixed constant is the single most powerful shift you can make in strategy design. Position sizing, stop distances, and trade-frequency assumptions should all adapt when the volatility environment changes.
Step-by-step integration of volatility into your daily routine:
- Morning check: Before your trading session, pull the ATR reading for your primary pairs. Note whether it’s above or below its 20-day average.
- Regime classification: Label the current environment as calm (ATR below average) or elevated (ATR above average). This determines which version of your strategy parameters you apply.
- Adjust lot size: In calm conditions, you may use your standard lot size. In elevated conditions, reduce by 25-50% to keep dollar risk consistent despite wider price swings.
- Widen or tighten stops: Use the ATR-based stop calculation covered in the earlier section. Never use fixed pip stops regardless of current volatility.
- Filter trade frequency: In extremely high-volatility regimes, reduce the number of trades your system takes. Fewer, higher-quality setups beat high-frequency noise trading during chaos.
- Post-session review: Log the realized ATR for the session and compare it against your pre-session expectation. This builds your intuition for volatility regime shifts over time.
For automated traders, these steps can be encoded directly into your EA’s logic. Many of the most robust profitable trading strategies already incorporate some form of volatility-based position scaling. If you’re running an EA that doesn’t adapt to volatility at all, you’re running a system with a fixed engine in a world of changing terrain. Reviewing EA strategies for volatility can give you concrete examples of how algorithmic approaches handle regime changes in real market conditions.
Why treating volatility as a living risk variable gives traders an edge
Here’s the uncomfortable truth most trading courses skip: the majority of retail traders build strategies in a stable backtested world, then deploy them into a live market that constantly shifts its volatility distribution. The strategy doesn’t fail because the logic is wrong. It fails because the risk assumptions were frozen in time.
Most traders still treat volatility as background noise, something to be aware of during news events but otherwise ignored. The traders who outperform over years treat volatility as the heartbeat of the market. It tells you when to size up, when to step back, when a trend is real and when it’s just noise amplified by thin conditions.
We’ve seen this pattern repeatedly: traders who build flexible, regime-aware systems outperform during both calm and stormy markets. During calm periods they run tighter, more frequent strategies. During volatile periods they switch to wider stops, fewer trades, and reduced position sizes. Their equity curves don’t flatline during spikes. They just adapt.
Another powerful but often overlooked application is portfolio thinking across volatility regimes. Instead of running a single EA for all conditions, consider running different systems for different volatility states. One system optimized for ranging, low-volatility markets. Another built for trending, high-volatility conditions. This diversified trading approach meaningfully reduces drawdown because at least one system is always in its preferred environment. It’s not a silver bullet. But it’s a far more robust framework than trying to make one rigid system work in every market condition.
Enhance your trading with volatility-aware automation
If the concepts in this article have you thinking about how to upgrade your trading infrastructure, you’re ready for the next step. Understanding volatility is powerful, but encoding it into a system that monitors, adapts, and executes without emotional interference is where the real edge lives.
At FxShop24, we specialize in exactly this. Our AI trading bot is designed to handle volatility shocks and adjust execution parameters in real time, keeping your risk profile consistent regardless of market regime. For traders who want a broader solution, our range of automated trading systems covers diverse strategies built for both calm and volatile conditions across forex and gold markets. You can also deepen your analysis with our curated forex indicators for volatility, designed to work seamlessly inside MT4 and MT5. All products come with lifetime updates and full installation support.
Frequently asked questions
What causes high volatility in the forex market?
High volatility is usually triggered by economic news, central bank actions, or market shocks that significantly alter currency demand or supply. Volatility is strongly event-dependent, meaning the same strategy can face very different conditions across sessions and news periods.
How can traders measure forex market volatility quickly?
Most traders use the Average True Range (ATR) indicator to measure how much a currency pair typically moves over a set period. ATR captures typical price movement over a lookback window and expresses it in pips, making it immediately usable for stop-loss sizing.
What is the difference between realized and implied volatility?
Realized volatility looks at past price moves, while implied volatility reflects the market’s expectations based on options pricing. The realized vs implied distinction is critical because implied volatility can signal forward-looking risks that historical data simply cannot show.
Should volatility affect my forex trading risk management?
Yes, position sizing and stop levels should adapt to current volatility conditions to properly control risk and maximize opportunity. Treating volatility as a state variable rather than a fixed constant is essential for building strategies that hold up across different market environments.