


5
Jun
How to Analyze Trading Performance Effectively
TL;DR:
- Trading performance analysis involves using key metrics like profit factor, expectancy, and maximum drawdown to evaluate your true trading edge. Systematic filtering and structured reviews help identify effective strategies and prevent overreaction to short-term results. Consistent use of process metrics, proper sample sizes, and disciplined journaling improve trading outcomes and decision-making.
Trading performance analysis is the process of measuring your trading results through specific quantitative metrics and structured reviews to reveal your true edge and areas for improvement. Total profit and loss tells you almost nothing on its own. A trader who made $5,000 last month could be one bad week away from blowing their account, while another who broke even might be sitting on a statistically proven edge. The difference lies in understanding metrics like profit factor, expectancy, and maximum drawdown, and using tools like TradeZella or Edgewonk to turn raw trade data into decisions you can act on.
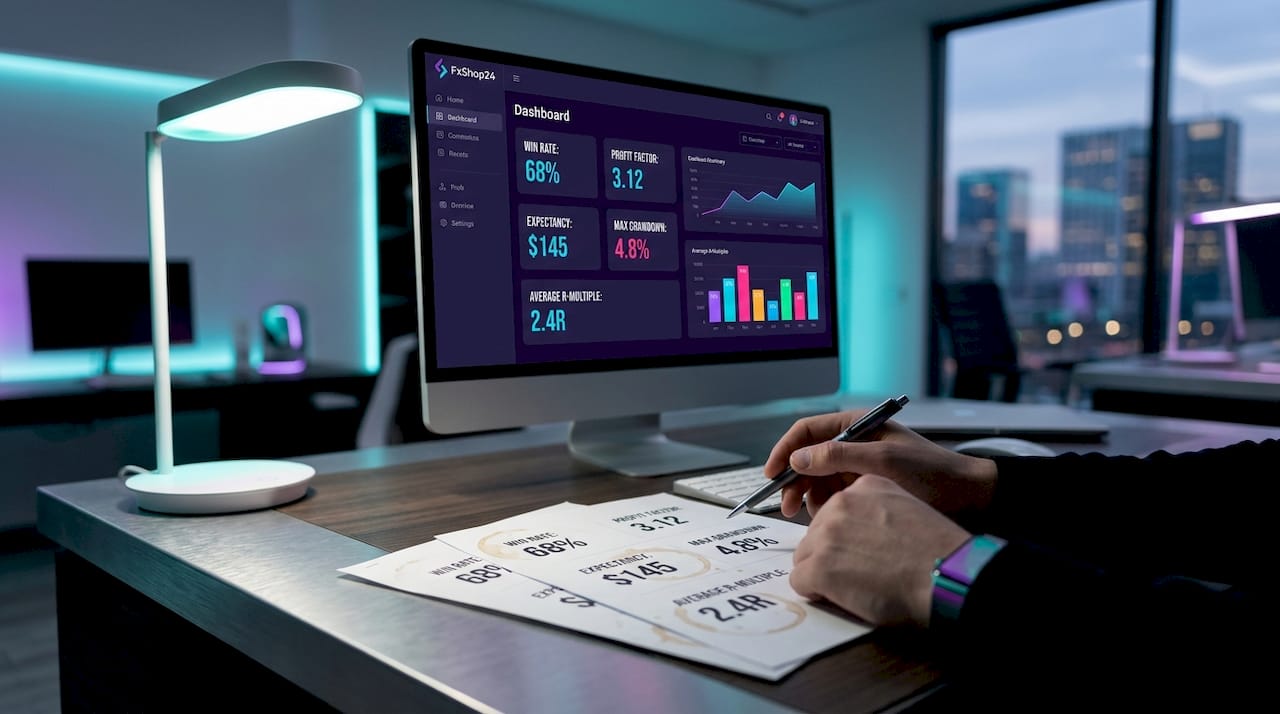
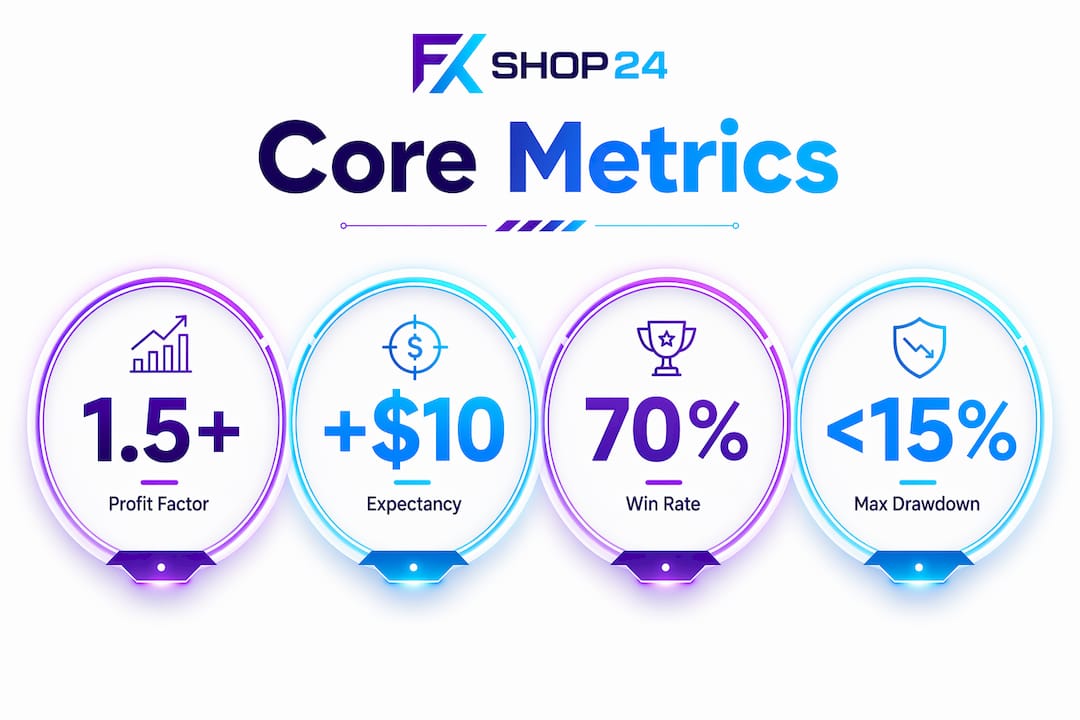
How to analyze trading performance with the right core metrics
The five core metrics every trader needs are win rate, profit factor, expectancy, maximum drawdown, and average R-multiple. Each one answers a different question about your trading, and none of them is sufficient alone. Together, they define whether you have a real edge or just a lucky streak.
Profit factor and what it tells you about your edge
Profit factor is your total gross profit divided by your total gross loss. A profit factor above 1.0 means you are making more than you are losing. The grading scale matters here: below 0.8 is an F, 1.2 to 1.5 is a solid B, 1.5 to 2.0 is an A, and above 2.0 is excellent but requires a large sample to trust. A profit factor of 1.3 is a real, tradeable edge for most retail strategies.
Expectancy, win rate, and R-multiple
Expectancy is the average dollar amount you expect to win per trade, calculated as (win rate × average win) minus (loss rate × average loss). A positive expectancy confirms you have an edge. Win rate alone is misleading because a 70% win rate with a 1:0.3 reward-to-risk ratio produces a negative expectancy. The average R-multiple, which should sit above 0.2R for a profitable system, ties win rate and reward-to-risk together into a single number that reflects true profitability per unit of risk.
Maximum drawdown and sample size
Maximum drawdown measures the largest peak-to-trough decline in your account equity. Keeping it below 15% is a reasonable personal benchmark for most traders, though prop firm rules often set stricter limits. Sample size is equally critical: below 60 trades gives you almost no statistical confidence, while 200 or more trades with consistent metrics provide genuine edge validation. Treating a 20-trade winning streak as proof of a system is one of the most common and costly mistakes in trading.
| Metric | What it measures | Benchmark |
|---|---|---|
| Profit factor | Gross profit vs. gross loss ratio | Above 1.3 solid, above 1.5 strong |
| Expectancy | Average dollars won per trade | Must be positive |
| Win rate | Percentage of winning trades | 40-60% typical; context-dependent |
| Max drawdown | Largest equity decline from peak | Below 15% personal threshold |
| Average R-multiple | Profit per unit of risk per trade | Above 0.2R for profitability |
Pro Tip: Always calculate your metrics net of spreads, commissions, and slippage. Gross metrics can make a losing strategy look profitable, especially in forex and gold where execution costs vary significantly by broker.
How to use multidimensional filtering to find your real edge
Aggregate metrics can hide more than they reveal. A strategy with a profit factor of 1.2 overall might have a profit factor of 2.0 on Tuesday morning setups and 0.5 on Friday afternoon trades. Filtering your performance data by specific dimensions is how you separate the parts of your trading that actually work from the parts that are quietly draining your account.
The most productive filtering dimensions are:
- Strategy or setup type: Different setups often have completely different statistical profiles. Breakout trades and mean-reversion trades should never share the same performance bucket.
- Time of day: Many traders find they lose consistently during the first 30 minutes of a session and profit during the overlap hours. You will never know until you filter.
- Day of week: Mondays and Fridays in forex often carry higher spread costs and lower liquidity, which can flip an otherwise profitable setup into a losing one.
- Ticker or instrument: Gold (XAUUSD) behaves differently from EUR/USD. A strategy optimized for one may perform poorly on the other.
- Holding time: Short-term scalps and multi-hour swing trades have different risk profiles. Mixing them in aggregate analysis obscures both.
The correct process is to test one filter at a time. Single-variable sequential testing prevents overlapping effects from distorting your conclusions. If you filter by day of week and setup type simultaneously, you cannot tell which variable is driving the result.
Confirmation bias is the biggest threat here. Pre-declared filters and full-dataset analysis must come before you look at results. Deciding which trades to include after you already know the outcome produces metrics that feel convincing but are statistically worthless. Set your filter criteria in advance, run the analysis on the complete unfiltered dataset first, and only then apply the filter to test your hypothesis.
Pro Tip: Keep a filter log. Write down every filter you test, its result, and whether you declared it before or after seeing the data. This single habit separates disciplined analysis from post-hoc rationalization.
What does a structured trading review process look like?
A structured review turns raw metrics into decisions. Without a defined process, most traders either review too often and overreact to noise, or review too rarely and miss real deterioration in their edge. The right cadence is a 30-minute weekly review and a one-hour monthly deep dive.
Here is a practical weekly review workflow:
- Pull your dashboard KPIs. Look at net P&L, win rate, profit factor, expectancy, and max drawdown for the past week. Compare each figure to your 30-day rolling average.
- Check rule adherence. Count how many trades followed your written plan. Rule adherence is a leading indicator of future P&L. Declining adherence predicts account deterioration before it shows up in your profit numbers.
- Flag outliers. Identify any trade that was more than 2R outside your normal range, whether a big winner or a big loser. Outliers distort aggregate metrics and deserve individual review.
- Make one decision. Identify the single clearest issue or opportunity. Introduce only one change to your process at a time. Multiple simultaneous changes make it impossible to attribute cause.
- Document the decision. Write it down with a date. You will need this record at your monthly review to assess whether the change worked.
“The goal of a weekly review is not to judge your results. It is to understand them well enough to make one better decision next week.” This distinction keeps traders from emotional overreaction and keeps the focus on process quality rather than outcome.
The monthly review follows the same structure but adds a longer-term lens. Compare your current 30-day metrics to your 90-day averages. Look for trends in expectancy and profit factor, not just single-week spikes. A structured monthly review is where you decide whether to scale a strategy, reduce position size, or retire a setup entirely.
How to build a trading dashboard and journal for better analysis
A trading dashboard is the control panel for your performance evaluation. The eight KPIs that belong on every trader’s dashboard are win rate by setup, expectancy, profit factor, maximum drawdown, trade count, time-of-day performance, rule adherence rate, and rolling 30-day expectancy trend. Dashboards tracking rolling metrics let you catch a declining expectancy trend weeks before it shows up as a significant P&L loss.
The distinction between process metrics and outcome metrics is one of the most underused concepts in trading analysis. Outcome metrics like P&L and win rate tell you what happened. Process metrics like rule adherence and trade count tell you why it happened. Process quality predicts future profitability better than any single outcome metric because it measures the inputs you actually control.
A trading journal captures what a dashboard cannot. The most valuable journal entries include:
- Trade data: Entry price, exit price, position size, setup type, and holding time.
- Market context: Session, volatility conditions, news events, and instrument behavior.
- Behavioral notes: Emotional state before entry, whether you followed your plan, and what you were thinking at the moment of decision.
Behavioral and emotional data in a journal closes the feedback loop between your planned strategy and your actual execution. Most traders who review their journals honestly find that their worst trades share a behavioral pattern, not a market pattern. That insight alone is worth months of metric analysis.
Automated tools like TradeZella, Edgewonk, and Trademetria import your trade history directly from MT4 or MT5, calculate all core metrics automatically, and generate visual dashboards without manual data entry. For forex and gold traders running multiple strategies, these tools save hours per week and eliminate the calculation errors that corrupt manual spreadsheets. You can also review how to evaluate trading robots using the same quantitative framework to assess automated systems with the same rigor you apply to manual trades.
Key takeaways
Effective trading performance analysis requires combining quantitative metrics, systematic filtering, and structured reviews to identify your true edge and eliminate what is quietly costing you money.
| Point | Details |
|---|---|
| Use five core metrics | Profit factor, expectancy, win rate, max drawdown, and R-multiple together define your real edge. |
| Filter by one dimension at a time | Sequential single-variable filtering prevents overlapping effects and reveals true performance drivers. |
| Review weekly and monthly | A 30-minute weekly review and one-hour monthly deep dive catch deterioration before it becomes costly. |
| Track process metrics, not just outcomes | Rule adherence predicts future P&L better than win rate or profit alone. |
| Use net metrics only | Always calculate performance after spreads, commissions, and slippage to reflect true profitability. |
Why most traders are measuring the wrong things
After years of working with forex and gold trading systems at Fxshop24, the pattern I see most often is traders who are obsessed with their P&L and almost completely blind to the metrics that actually explain it. A trader comes to us frustrated that their EA is “not working,” and when we pull the actual data, the profit factor is 1.4, the expectancy is positive, and rule adherence is 60%. The EA is fine. The execution is the problem.
The sample size illusion is the second most common trap. Traders draw firm conclusions from 30 or 40 trades, then rebuild their entire strategy around what is essentially statistical noise. You need at least 200 trades with consistent metrics before you can trust what the numbers are telling you. Anything less is a story you are telling yourself.
What I have found actually works is treating rule adherence as the primary KPI during any strategy development phase. If you cannot follow your own rules consistently, no amount of metric optimization will save you. Fix the process first. The numbers follow. Commit to a weekly review, even a short one, and write down one decision each time. That single habit compounds faster than any indicator or filter you will ever find.
Take your trading analysis further with Fxshop24
Fxshop24 builds and tests automated trading systems for forex and gold on MT4 and MT5, so you can apply the same performance metrics covered in this article to systems that execute with perfect rule adherence every time. Our automated futures trading systems are built with profit factor, drawdown, and expectancy targets built in from the start, and every system ships with full performance data so you can verify the numbers yourself. If you want to explore the software side of performance tracking, our guide to trading software for forex and gold covers the tools that complement manual analysis with automation. Pair disciplined manual review with a well-tested EA and you have a performance system that works on both sides of the equation.
FAQ
What metrics matter most for trading performance evaluation?
The five metrics that matter most are profit factor, expectancy, win rate, maximum drawdown, and average R-multiple. No single metric is sufficient. They must be read together to assess whether a trading edge is real and sustainable.
How many trades do I need before my metrics are reliable?
Fewer than 60 trades give you almost no statistical confidence. You need 200 or more trades with consistent metrics to validate a trading edge with reasonable certainty.
How often should I review my trading performance?
A 30-minute weekly review comparing current metrics to your 30-day averages, combined with a one-hour monthly deep dive, gives you the right balance between catching problems early and avoiding overreaction to short-term noise.
Why is win rate alone not enough to assess trading success?
A high win rate with a poor reward-to-risk ratio produces a negative expectancy, meaning you lose money over time despite winning most trades. Win rate only becomes meaningful when paired with average win size and average loss size.
What is the difference between process metrics and outcome metrics?
Outcome metrics like P&L and win rate measure what happened. Process metrics like rule adherence and trade count measure how you traded. Process metrics predict future profitability better because they reflect the inputs you control directly.