


18
May
Role of indicators in trading: expert guide for forex and gold
TL;DR:
- Adding more indicators does not improve trading performance; instead, it often causes confusion and false signals.
- Effective trading relies on combining one indicator from each core category—trend, momentum, and volume—to enhance accuracy and reliability.
Most traders add more indicators when their strategy stops working. It feels logical. More data should mean better decisions. But the opposite is usually true. The role of indicators in trading is not to cover your chart in signals — it is to read the market through a clear, structured lens. Traders who stack eight or more tools on a single chart often see performance drop, not improve. This guide cuts through that confusion and shows you exactly how to select, combine, and apply indicators for forex and gold markets, with specific attention to automated systems running on MT4 and MT5.
Table of Contents
- Understanding types and functions of trading indicators
- How combining complementary indicators boosts trading performance
- Top indicators and strategies for forex and gold trading
- Challenges and expert nuances in indicator-based trading
- Applying indicator insights in automated trading platforms
- Why mastering indicator combinations beats chasing the “perfect” indicator
- Explore automated trading solutions leveraging powerful indicators
- Frequently asked questions
Understanding types and functions of trading indicators
Before you decide which indicators belong on your chart, you need to understand what each one is actually measuring. Technical indicators transform raw market data like price and volume into clear signals that help identify trends, momentum, and volume patterns for better trading decisions. That sounds straightforward, but most traders treat all indicators as interchangeable. They are not.
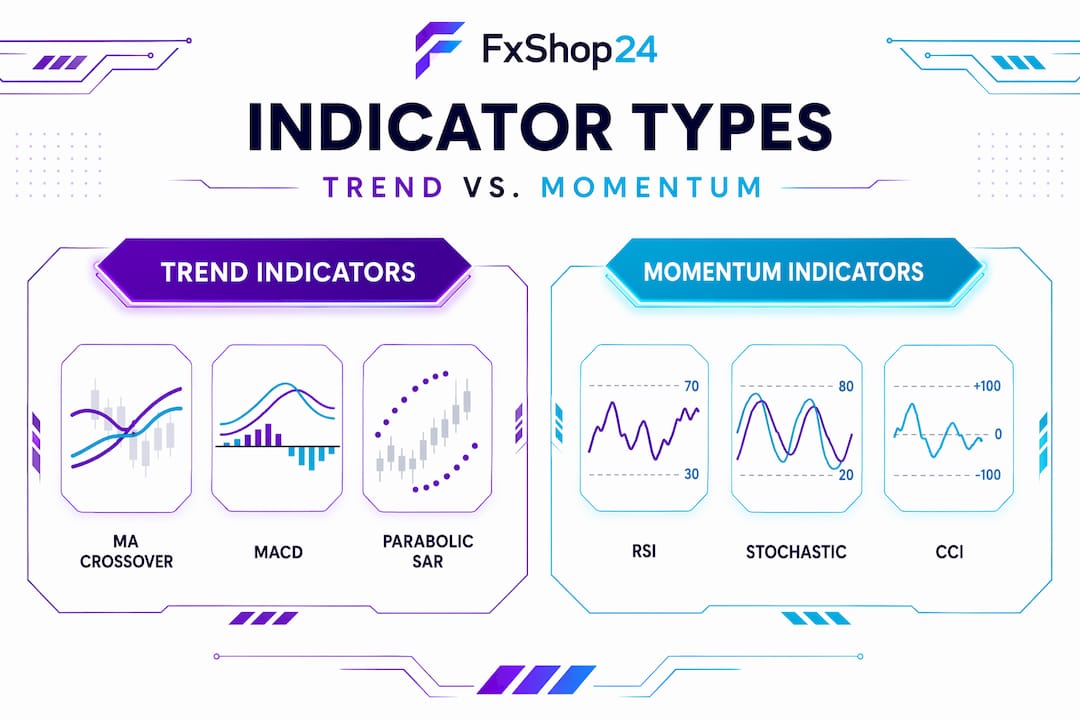
There are three core categories, and each one answers a different question about the market:
- Trend indicators tell you where the market is going. Moving averages (SMA and EMA), the ADX, and Ichimoku Cloud are the primary tools here. They work best in directional markets and lose value fast when price chops sideways.
- Momentum indicators tell you how fast the move is happening and whether it is losing steam. RSI, MACD, and the Stochastic Oscillator are the workhorses of this category. They excel at timing entries and spotting divergences before reversals.
- Volume indicators tell you who is behind the move. On-Balance Volume (OBV) and Volume Profile reveal whether institutional money is participating or whether a breakout is running on thin air. These are the most underused category among retail traders.
Indicators explained by Fidelity reinforce this point: each indicator type filters a specific dimension of price behavior. Using only momentum indicators, for example, is like reading a map with only elevation data. You know the terrain but not the direction you are traveling. For practical forex indicator examples across these categories, the differences become immediately visible in real chart conditions.
Having introduced the necessity of indicators, next we explore how combining these tool types improves trading outcomes.
How combining complementary indicators boosts trading performance
Here is the mistake most retail traders make: they stack five RSI variants, MACD, and a Stochastic, think they have five signals, and then wonder why every signal fires at the same time and still loses. Those are not five indicators. They are one indicator repeated five times. All three measure momentum. You get confirmation of a confirmation of a confirmation, while trend and volume tell a completely different story.
The synergy of complementary tools is why experienced traders build setups with one indicator from each category. Trend tells you the direction. Momentum confirms the strength of that direction. Volume validates that real money is moving the market. When all three agree, the probability of a winning trade rises meaningfully.
The data backs this up. Traders using 3 to 5 complementary indicators outperform those using 8 or more by an average of 14.7% annually, according to a 2024 study. That is not a marginal edge. It is the difference between a strategy that grows your account and one that slowly grinds it down through noise and overtrading.
“Successful traders combine 2 to 4 complementary technical indicators instead of relying on a single signal.” — Investopedia, 2025
The key benefits of this multi-category approach include:
- Fewer false entries because multiple filters must agree before a trade triggers
- Cleaner stop placement based on actual structure rather than indicator crossover noise
- Better regime detection, knowing when to trade and when to stand aside
- Reduced analysis paralysis because each indicator has a defined, non-overlapping job
IG’s trading strategist insights point out that no single indicator dominates universally. Effectiveness always depends on strategy and context. That reality is actually good news. It means indicator selection is a skill you can build, and trading system advantages compound quickly once you understand it.
Top indicators and strategies for forex and gold trading
Gold (XAUUSD) and major forex pairs like EURUSD and GBPUSD are not the same markets. Gold moves on sentiment, geopolitical flow, and dollar correlation. Forex pairs move on rate differentials and macro data. The indicators that work best on each reflect those differences, though there is significant overlap.
| Indicator | Type | Best use case | Approximate win rate |
|---|---|---|---|
| EMA/SMA crossover | Trend | Gold and forex trending setups | 65-70% on XAUUSD with ADX filter |
| ADX | Trend filter | Confirming trend strength before entry | Reduces false signals by ~30% |
| RSI | Momentum | Divergence entries, overbought/oversold | Context-dependent |
| MACD | Momentum | Trend confirmation, momentum shifts | Lagging, better for confirmation |
| Bollinger Bands | Volatility | Range identification, breakout setups | High in ranging markets |
| Stochastic Oscillator | Momentum | Timing short-term entries | Best combined with trend filter |
| ATR | Volatility | Stop placement and position sizing | Not a signal tool, a measurement tool |
EMA and SMA crossovers combined with trend filters achieve 65 to 70% win rates on spot gold in trending markets, outperforming standalone oscillators. Add an ADX filter above 25, and you eliminate most of the range-bound false signals that destroy crossover strategies. That single combination, trend plus momentum filter, already gives you a foundation most retail traders never build.
Technical frameworks using moving average crossovers and MACD outperformed buy-and-hold on SPY and QQQ from 2007 to 2023 with higher returns and smaller drawdowns. That includes two major bear markets and multiple high-volatility regimes.
RSI divergence is underrated on gold specifically. When XAUUSD makes a higher high but RSI prints a lower high, the probability of a pullback is significant. Used alone, RSI gives unreliable signals. Used as a divergence filter on top of a trend-confirmed setup, it becomes one of the highest-probability entry timing tools available. See a working gold trading strategy example to observe how this plays out in live conditions.
Pro Tip: When trading gold, replace standard 14-period RSI with a 10-period setting. Gold moves faster and harder than most forex pairs. The shorter lookback keeps your momentum readings current without chasing price. Combine it with a 50 and 200 EMA trend structure, and you have a setup that works across H1 and H4 timeframes without constant recalibration. Pairing this with trend following in forex and gold gives you a complete directional framework.
Challenges and expert nuances in indicator-based trading
Indicators are not magic. They are backward-looking calculations applied to forward-moving markets. Understanding their limitations is not optional, it is the foundation of using them well.
Here are the most common failures in indicator-based trading:
- Lagging signals on fast markets. MACD and moving averages can give entries 15 to 30 candles after the move has already started. On gold’s H1 chart during a news event, that lag can be the difference between entering at value or chasing a spike.
- Range whipsaws. Trend indicators perform poorly when markets consolidate. An EMA crossover in a sideways range will generate 5 to 10 false signals before the actual breakout arrives.
- False breakouts on low volume. Bollinger Band squeezes look identical whether they resolve into a real trend or a fakeout. Volume confirmation is the only filter that consistently separates the two.
- RSI misuse on gold. RSI oversold signals on gold only result in bounces 34% of the time over 20 years unless filtered by momentum quality and overextension guards. That is barely better than a coin flip, and many traders treat it as a high-probability signal.
- Poor backtesting quality. Backtests with less than 99% tick modeling quality and fewer than 200 to 300 trades on MT4 produce unreliable results. A strategy that looks profitable on 50 trades with 90% modeling quality is almost certainly curve-fitted.
Pro Tip: Institutional traders validate their primary signals using the 200-day moving average and monthly MACD as long-term regime filters. If the monthly MACD is bearish and price is below the 200 DMA, they avoid long setups entirely, regardless of what shorter-term indicators suggest. Adopting this top-down structure can eliminate an entire category of losing trades from your record. Review automated strategy optimization techniques to apply this type of regime filtering inside your EA settings.
Applying indicator insights in automated trading platforms
Automated trading on MT4 and MT5 does not change the principles above. It enforces them with mechanical precision. An EA built on a poorly designed indicator combination will execute bad trades faster and more consistently than any human trader could. The upside works both ways: a well-built EA with a solid indicator foundation will execute high-probability setups without hesitation, emotion, or fatigue.
Here is a process that works:
- Select your indicator stack by category. Choose one trend indicator, one momentum indicator, and one volume or volatility confirmation tool. Three to four total. Do not add a fourth unless it fills a gap none of the first three address.
- Define entry and exit logic precisely. Indicators should produce binary conditions: is the trend up or down, is momentum confirming or diverging, is volume above average or below? Ambiguity in this step creates inconsistent EA behavior.
- Run backtests with 99% tick data and 500-plus trades. High-quality tick data is critical for reliable automated strategy evaluation. Anything less distorts spread modeling and skips real market noise.
- Set ATR-based stops and position sizing. ATR scales your stop distance to current volatility. A fixed pip stop on gold during a high-volatility week will stop you out of valid setups constantly. ATR adapts automatically.
- Forward test on a demo account for 60 to 90 days before live deployment. Market regimes shift. A strategy optimized on 2023 gold data will behave differently in 2026 conditions. Forward testing catches this before it costs real capital.
Successful trading systems integrate 2 to 4 complementary indicators combined with proper risk management to outperform naive single-indicator strategies. The forex automation workflow translates these steps into a repeatable system you can implement on MT4 or MT5. For parameter selection, choosing EA settings and then optimizing trading robots form the two-stage process that separates consistently profitable automated systems from those that fail after the first regime change.
Why mastering indicator combinations beats chasing the “perfect” indicator

Here is the uncomfortable reality most trading content avoids: the search for the perfect indicator is a psychological trap, not a technical problem. Traders who keep switching indicators are not looking for edge. They are looking for certainty in a probabilistic environment. No indicator gives you certainty. The sooner you accept that, the faster your performance will improve.
No single indicator is universally best; effectiveness depends on strategy and context, and indicators should support decision-making alongside risk management, not replace it. That quote from IG is one of the most practically useful things you can internalize as a trader.
What actually separates consistently profitable traders from the rest is not the indicator list. It is context awareness. They ask: what is the market regime right now? Is this a trending environment or a range? What does the higher timeframe structure say? Only then do they look at indicator signals, and they weigh those signals against the context, not in isolation. Learn from system optimization tips that apply this exact thinking to automated systems.
Volume and institutional flow data are the most underutilized edge amplifiers available to retail traders today. When you see a breakout confirmed by a genuine volume surge, the probability of follow-through is structurally different from a breakout on thin volume. Most retail traders never add this layer because it is less intuitive than an RSI number. That is precisely why it still works.
The traders who succeed long-term are not the ones with the most sophisticated indicators. They are the ones who deeply understand three to four tools, know exactly when those tools work and when they fail, and have the discipline to wait for conditions where every filter aligns before committing capital.
Explore automated trading solutions leveraging powerful indicators
If you have spent time building and refining indicator combinations manually, you already know how much is involved. Selecting tools, testing parameters, validating across market regimes, and then managing risk in live conditions requires consistent effort that most traders cannot sustain alongside other responsibilities.
FxShop24’s automated futures trading systems are built around exactly the principles covered in this guide: complementary indicator combinations, high-quality backtesting, and ATR-based risk management baked in from the start. Each system in the automated trading systems for MT4 and MT5 catalog is designed for forex and gold markets with prop firm compatibility and lifetime updates included. If you want to start from a validated foundation and spend your energy on optimization rather than construction, explore optimizing trading robots to see how FxShop24’s tools can be fine-tuned to your specific trading conditions.
Frequently asked questions
What are the main categories of trading indicators and why should I combine them?
Trading indicators fall into trend, momentum, and volume categories, each revealing a different dimension of market behavior. Combining indicators from different categories provides a complete market picture that no single category can deliver alone.
How many indicators should I use on my trading charts?
Three to five complementary indicators is the evidence-backed answer. Traders using 3 to 5 complementary indicators outperform those using 8 or more by 14.7% annually, making simplicity the practical choice.
Can technical indicators guarantee profits when used alone?
No indicator can guarantee profits. Indicators should support decision-making alongside risk management rather than replace it, and their effectiveness always depends on market context and how they are combined.
Are automated trading systems effective for forex and gold markets?
Well-built automated systems incorporating complementary indicator combinations and rigorous validation can improve consistency significantly. Proper backtesting with high-quality tick data is the non-negotiable foundation for any automated strategy deployed in live forex or gold markets.