
26
Oct
XAUUSD Weekly Outlook: Below $4,000 and Staring at the June Floor as the FOMC Looms (Week of October 26, 2026)
Where price stands
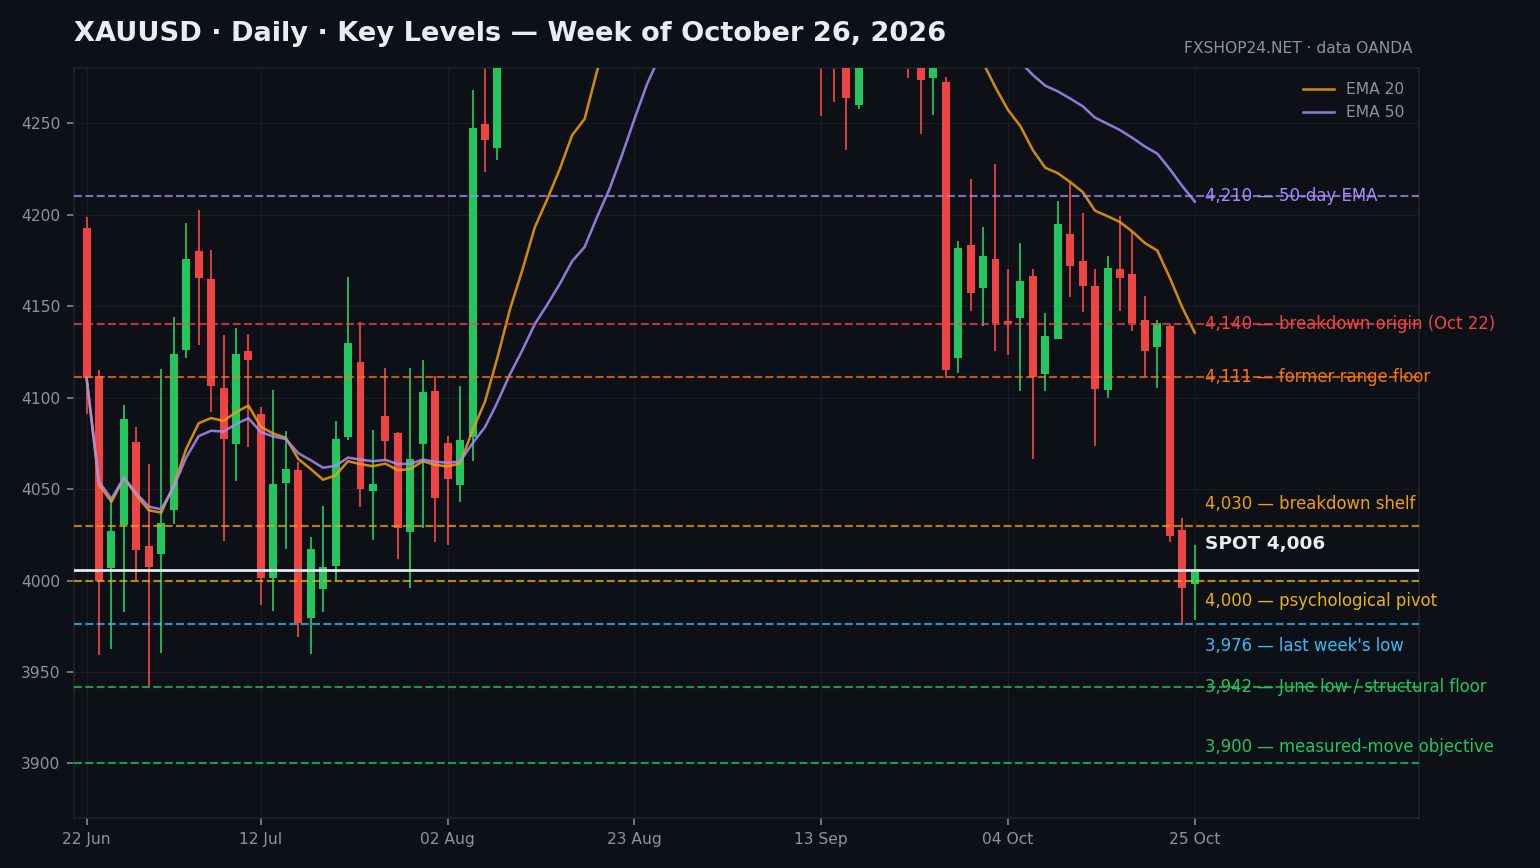
Spot gold trades around 4,006 on Monday morning (October 26) — back above the round number after Friday’s close at 3,996 made it official: gold ended the week below $4,000 for the first time since July, down more than 4% in its worst week since June. The damage was done on Thursday: an AI-driven slide in US tech (Nasdaq −2.6%) triggered a cross-asset liquidity scramble, gold fell $116 in one session from roughly 4,140 to a 4,021 close, and the break of the 4,105/4,067 support shelf cascaded straight into stop-loss selling. Friday extended to 3,976 before stabilizing; this Monday’s early range is a tight 3,978–4,019.
Structurally, this is the moment the whole correction has been building toward. Price now sits barely $35 above the June 29 low at 3,942 — the floor that has defined the four-month pullback from the May peak at 4,774. The breakdown also launched price well clear of the moving averages: the 20-day EMA (≈4,136) and 50-day EMA (≈4,210) are now resistance, not support. Analysts are split on what the flush means: some call it a margin-call-driven, liquidity event (oversold, hedge funds near net short, central banks still buying ~60–80 tonnes a month), others see the Fed’s inflation-fighting tightening and a firm dollar as a durable ceiling. Both camps agree on one thing — this week’s FOMC (Wednesday, October 28) is the verdict. A hold is expected, but Chair Warsh’s message on a possible December hike will set gold’s next $100.
Key levels
| Level | Type | Why it matters |
|---|---|---|
| 4,210 | Resistance | 50-day EMA — the bear-market line of the whole correction; a recovery above it is what technicians want to see before calling the low |
| 4,140 | Resistance | Thursday’s breakdown origin (Oct 22 open), with the 20-day EMA (≈4,136) just beneath — the first serious hurdle on any bounce |
| 4,111 | Resistance | Former range floor (Oct 20–21 lows) — broken support turns resistance |
| 4,030 | Resistance | Breakdown shelf: Oct 22 close (4,024) / Oct 23 rebound high (4,034) — sellers defended it Friday |
| 4,000 | Pivot | The psychological line — Friday closed below it, Monday is fighting to reclaim it; acceptance back above would ease the panic |
| 3,976 | Support | Last week’s low (Oct 23), retested Monday — the immediate floor |
| 3,942 | Key support | June 29 low — the structural floor of the entire correction; a weekly close below changes the trend, full stop |
| 3,900 | Major support | Round number and the widely cited measured-move objective if 3,942 breaks |
Two scenarios
Bearish (base case while below 4,030): the breakdown is barely 48 hours old and the macro still leans the same way — hot inflation, a hawkish-hold Fed, a firm dollar. If Warsh keeps a December hike squarely on the table Wednesday and Thursday’s GDP (≈3.2% consensus) and PCE confirm the pressure, expect 3,976 to give way and the market to go test 3,942. A weekly close below the June low opens 3,900, then 3,850–3,800. Invalidation: a daily close back above 4,111.
Bullish (short-covering salvage): Thursday had all the hallmarks of forced selling, not fundamentals — a $116 liquidity flush into thin stops, with central-bank demand underneath and speculators near record short. If the Fed holds and Warsh softens the December message (or GDP/PCE disappoint), the squeeze through 4,030 and 4,111 can be violent; 4,140 and the 50-day at 4,210 define the full recovery path. Many desks only call the correction over above ~4,230. Invalidation: a daily close below 3,942.
Calendar watch
- Monday, October 26: no US data — a thin session with geopolitics (Middle East/Iran headlines around the US midterms) doing the talking. Confirm exact dates on the calendar.
- Tuesday, October 27: durable goods (8:30 am ET), consumer confidence and new home sales (10:00 am ET) — secondary, but weak prints would feed the “peak rates” narrative. FOMC meeting begins.
- Wednesday, October 28: FOMC decision at 2:00 pm ET, Chair Warsh’s press conference at 2:30 pm ET. A hold is priced at roughly 90% — the statement language and Warsh’s tone on December are what move gold.
- Thursday, October 29: Q3 GDP advance (8:30 am ET, ≈3.2% consensus), September PCE and core PCE, personal income & spending, weekly jobless claims — a full slate two hours before the ECB decision (1:15 pm UTC) and a Bank of Japan meeting this week.
- Friday, October 30: Employment Cost Index (8:30 am ET) — the wage-inflation read that matters for the December debate; Chicago PMI (9:45 am ET); first post-Fed speakers (Daly, Musalem, midday ET).
- No NFP this week — the next Employment Situation report is Friday, November 6.
EA angle
- Volatility regime: the headline ATR (~$66) still understates it — Thursday alone printed a $119 range. Treat this as an expansion regime: grids widened, and expect $80–120 days around the FOMC rather than the compressed $65 norm of mid-October.
- News filters: this is the big one. Freeze all gold EAs a full 60 minutes before Wednesday’s 2:00 pm ET statement and keep them off through the press conference; re-arm only after the 3:30–4:00 pm ET volatility settles. Thursday’s 8:30 am ET GDP/PCE stack gets the same treatment.
- Trend vs mean-reversion: momentum EAs finally have a clean trend signal after weeks of chop — but chasing shorts into 3,976/3,942 after a $140 two-day drop is poor risk/reward; a bounce into 4,030–4,111 that stalls is the higher-quality trend-following entry. Mean-reversion systems should treat 3,942–3,900 as a “knife” zone: fade only with confirmation (rejection wicks, reclaim of 4,000), never blind limit orders.
- Sizing: halve risk through Wednesday. A hawkish hold with firm guidance can gap gold $50–80 against you in minutes; expect stop slippage well beyond backtest norms and size so that even a bad fill is a scratch, not a loss-limit breach.
FXShop24 Research Team — educational content, not investment advice. Trading gold? Read our guides on position sizing and gold-specific EA settings on fxshop24.net, and follow @fxshop24 on Telegram for weekly levels and free signals.