



28
May
What Is Indicator-Based Trading? A 2026 Guide
TL;DR:
- Most traders fail by using the wrong indicators or applying them incorrectly rather than trading without indicators.
- Building a layered, systematic approach that confirms signals across multiple tools increases reliability, reduces emotional bias, and improves results in live markets.
Most traders who blow their accounts aren’t trading without indicators. They’re trading with the wrong ones, used the wrong way. Understanding what is indicator-based trading goes far beyond slapping an RSI on a chart and calling it a strategy. The real power comes from building a structured, multi-layered system where indicators confirm each other rather than work in isolation. This guide breaks down exactly how indicator-based trading works, why most approaches fail, and how to build something that actually holds up in live markets.
Table of Contents
- Key takeaways
- What is indicator-based trading
- Advantages and limitations of indicator-based trading
- Building an effective indicator strategy
- Real strategy examples and performance data
- Practical tips for indicator trading success
- My take on building indicator systems that actually work
- Take your indicator strategy to the next level
- FAQ
Key takeaways
| Point | Details |
|---|---|
| Indicators need context | A single indicator rarely predicts price accurately; combine 3-4 complementary tools for reliable signals. |
| Volume confirmation matters | Breakouts with high volume succeed 73% of the time versus 39% without it. |
| Overload kills performance | Too many indicators create conflicting signals and push traders into emotional decisions. |
| Always backtest first | Testing on historical data before going live significantly reduces costly beginner mistakes. |
| Trend state comes first | Identify what the market is doing before applying any indicator entry rules. |
What is indicator-based trading
Indicator-based trading is a method of making buy and sell decisions using mathematical formulas applied to price, volume, or open interest data. Instead of relying on gut feel or news headlines, you use quantified signals generated by these formulas to determine when conditions favor entering or exiting a trade.
The key word is systematic. Indicators transform raw price data into readable signals, whether that’s a crossover, a threshold breach, or a divergence pattern. But they don’t tell you what will happen next. They tell you what has happened recently in a structured format, which you then use to make a probabilistic decision.
There are four main categories every trader should know:
- Trend indicators (like moving averages and MACD) show the overall direction of price over a defined period. They confirm whether a market is trending up, down, or sideways.
- Momentum indicators (like RSI and Stochastic) measure the speed and strength of price movement. They’re especially useful for spotting overbought or oversold conditions.
- Volume indicators (like OBV and VWAP) reveal whether price moves are backed by real participation from the market. Low-volume moves are often unreliable.
- Volatility indicators (like Bollinger Bands and ATR) show how wide price swings are, which helps you size positions and place stops intelligently.
Understanding the difference between leading and lagging indicators also matters here. Leading indicators like RSI attempt to predict future price turning points. Lagging indicators like moving averages confirm trends already in motion. Neither is superior. The most effective indicator trading strategies use both types in combination so you get trend confirmation and early entry signals working together.
Advantages and limitations of indicator-based trading
The biggest practical benefit of indicator-based trading is that it removes ambiguity. When your rules say “enter long when price is above the 50 EMA, RSI crosses above 40, and volume is above average,” you either have a signal or you don’t. That clarity reduces second-guessing and keeps emotions out of individual trade decisions.
The data supports this approach strongly. Combining 3-4 complementary indicators with confirmation rules outperforms single-indicator systems by 43% in risk-adjusted returns, with win rates reaching 65-72%. Compare that to single-indicator strategies, which produce profits only 35-42% of the time in ranging markets. The difference isn’t subtle.
“Indicators should support decision-making alongside broader analysis and risk control. No indicator is a perfect predictor, and they cannot anticipate unexpected economic or geopolitical events.” — IG International
That quote captures the main limitation in one sentence. Indicators interpret past data. A surprise central bank announcement or geopolitical shock will override every signal on your chart. This is why risk control, not just signal generation, has to be baked into any indicator-based system from the start.
The other major risk is indicator overload. Stacking 8-10 indicators on a single chart doesn’t make your analysis more precise. It makes it noisier. Too many indicators produce conflicting signals, which leads to analysis paralysis and emotional trading. Experts consistently recommend mastering one or two complementary indicators and testing rigorously before adding more.

Pro Tip: If your indicators ever give you three different “correct” answers about whether to enter a trade, that’s not analysis. That’s noise. Simplify until your rules give one clear answer.
Building an effective indicator strategy
Structure is everything. The traders who get consistent results from indicator-based systems aren’t using special indicators. They’re using a layered framework that addresses three distinct questions before every trade.
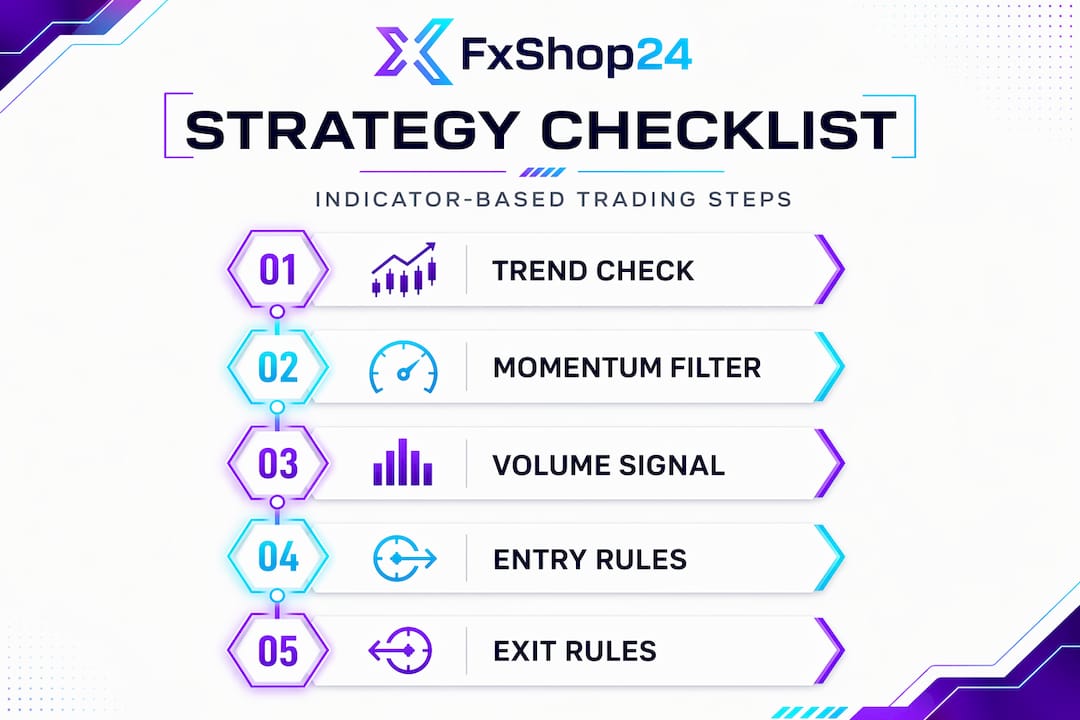
What is the trend? Use a trend indicator to establish direction. A 50-period EMA or 200-period moving average works well here. If price is above the EMA, you’re only looking for long setups. Below it, only shorts. This single filter eliminates a large percentage of bad trades before you even check another indicator.
Is there momentum in my direction? Once trend is confirmed, RSI or MACD gives you timing. An RSI reading below 35 in an uptrend suggests the pullback is extended and a bounce is likely. This is your entry trigger layer.
Is volume confirming the move? This is where most beginners skip a critical step. Multi-indicator systems that include volume reduce false signals by 62%. A breakout above resistance with volume at 150% of average has a 73% success rate. The same breakout with below-average volume succeeds only 39% of the time.
Here’s how a complete entry signal looks in practice using this framework:
| Condition | Indicator used | Required state |
|---|---|---|
| Trend direction | 50 EMA | Price above EMA (long bias) |
| Momentum timing | RSI (14) | RSI below 40 and rising |
| Volume confirmation | Volume MA | Current volume above 20-period average |
| Entry trigger | Candlestick pattern | Bullish close above prior candle high |
Every condition must be met before you enter. Miss one, skip the trade. This discipline is what separates systematic traders from chart readers who “feel” like a trade looks good.
The other critical variable is market regime. A momentum and trend strategy that crushes it in a trending market will get chopped apart in a sideways range. You need to identify trend state first before applying any entry rules. ADX above 25 typically signals a trending regime. Below 20, you’re in a range, and mean reversion setups become more effective than trend-following ones.
Pro Tip: Build two separate rule sets: one for trending markets and one for ranging markets. Then use ADX as the switch between them.
Real strategy examples and performance data
One of the most well-documented indicator-based strategies is the Internal Bar Strength (IBS) mean reversion system. The IBS value is calculated as (Close minus Low) divided by (High minus Low). Buying when IBS is below 0.1 and exiting when IBS exceeds 0.9 or after 10 days (to cap exposure) has shown solid long-term performance on indices like the Nasdaq. It’s simple, rules-based, and completely removes discretion from the process.
For traders who want to apply indicator examples on MT4 and MT5, the most commonly combined tools with documented performance are:
- MACD + RSI: Trend confirmation plus momentum timing. The MACD crossover sets the direction, RSI identifies the right moment within that trend.
- Bollinger Bands + Volume: Bands identify squeeze conditions while volume confirms when price is breaking out with genuine participation.
- VWAP + EMA: VWAP works particularly well on intraday charts as a dynamic support/resistance level, confirmed by EMA for bias direction.
- RSI + ATR: RSI spots potential reversals while ATR tells you how wide to set your stop, keeping position sizing rational relative to current volatility.
The performance difference between single and multi-indicator approaches is significant and consistent across research:
| Approach | Typical win rate | False signal rate |
|---|---|---|
| Single indicator only | 35-42% | High (60%+) |
| Two complementary indicators | 50-58% | Moderate (40-50%) |
| Three or more with confirmation | 65-72% | Low (28-35%) |
These numbers aren’t about finding a “perfect” setup. They reflect the statistical reality that confirmation filters eliminate a meaningful portion of low-quality signals before they become losing trades.
Practical tips for indicator trading success
Putting this all together requires habits as much as knowledge. Here’s what separates traders who build working systems from those who keep tweaking indicators without ever getting consistent results.
- Start with two indicators maximum. One trend, one momentum. Learn exactly how they behave across different market conditions before adding anything else.
- Backtest before you trade live. Testing on historical data is non-negotiable. It reveals how your system performs across different regimes and prevents expensive rookie mistakes in live markets.
- Define your rules in writing. Vague rules lead to vague execution. Write down every condition required for entry, every exit rule, and every position sizing calculation.
- Check reliability on mobile platforms as well, since mobile trading tools can display indicators differently, and signal timing may shift depending on the data feed.
- Review your trades weekly. Look specifically for trades where you followed your system and lost versus trades where you deviated and either won or lost. The goal is to improve the system, not just the outcome.
Pro Tip: If you find yourself constantly adjusting indicator parameters after a losing streak, stop. That’s curve-fitting, not optimization. Run a 100-trade backtest before changing anything.
My take on building indicator systems that actually work
I’ve watched traders spend months layering indicator on top of indicator, searching for a combination that produces clean signals with no losses. I’ve been guilty of this myself. The turning point came when I stripped everything back to two indicators and a clear trend filter. Suddenly, the system had rules I could actually follow without second-guessing every bar.
The real problem isn’t the indicators. It’s the belief that more inputs equal more certainty. They don’t. Shifting from signal chasing to understanding market state provides a far stronger foundation than any indicator combination alone. When I started asking “what is the market doing right now?” before asking “what is my indicator telling me?”, my decision quality improved immediately.
What I’ve found to be true is that no indicator works in all conditions. The ones that work best are the ones you understand deeply, test thoroughly, and apply only when market conditions match. Indicator-based trading succeeds when it’s treated as a framework for disciplined decision-making, not a shortcut to autopilot profits. The market will always find a way to punish lazy systems. Build one that’s simple, tested, and honest about what it can and can’t do.
— FxShop24
Take your indicator strategy to the next level
Understanding indicator-based trading is the foundation. Executing it consistently, especially in fast-moving forex and gold markets, is where automation changes the equation.
At Fxshop24, we specialize in MT4 and MT5 trading tools built specifically for traders who want their indicator logic working in the market 24 hours a day without sitting at a screen. Whether you’re looking to automate a trend-following setup or run a mean reversion system on gold, our automated trading systems cover a wide range of strategies with built-in risk controls. You can also explore our full breakdown of automated system types for MT4/MT5 to find what fits your approach. Every product ships with installation support and lifetime updates.
FAQ
What is indicator-based trading in simple terms?
Indicator-based trading means using mathematical formulas applied to price or volume data to generate buy and sell signals. Rather than trading on instinct, you follow defined rules based on what the indicators show.
Which indicators work best for beginners?
For indicator trading for beginners, a 50-period EMA for trend direction and RSI (14) for momentum timing is the most practical starting combination. These two cover the core questions of direction and timing without overcomplicating your decisions.
What are the main benefits of indicator-based trading?
The primary benefits of indicator-based trading include signal clarity, reduced emotional decision-making, and measurable entry and exit rules. Research shows that multi-indicator systems improve risk-adjusted returns by 43% compared to single-indicator approaches.
How many indicators should I use at once?
Most experienced traders use two to four complementary indicators covering trend, momentum, and volume. Using more than four typically causes conflicting signals and increases the risk of emotional trading rather than improving accuracy.
Do I need to backtest my indicator strategy before trading live?
Yes, without exception. Backtesting on historical data helps you understand how your system performs across different market conditions and prevents avoidable losses during the learning phase.