


24
May
Top Trading Indicators for Gold: 2026 Trader’s Guide
TL;DR:
- Gold’s unique behavior requires specialized indicators that analyze trend, momentum, volatility, and participation to avoid false signals. Combining a few well-chosen tools tailored to your trading style enhances decision-making, with proper adjustments to settings and timeframes being crucial. Building a disciplined, condition-specific indicator strategy helps traders adapt to gold’s changing volatility regimes and improves long-term consistency.
Gold doesn’t behave like most assets. It reacts to inflation data, geopolitical shocks, dollar strength, and pure sentiment, often all at once. That’s why selecting the top trading indicators for gold requires more thought than simply copying a standard forex setup. The wrong combination leaves you chasing false signals. The right one gives you a clear, layered read on trend direction, momentum, and volatility at the same time. This guide covers 10 indicators that work specifically well for gold, explains how each one functions, and shows you how to build a setup that fits your trading style.
Table of Contents
- Key takeaways
- How to select gold trading indicators that actually work
- 1. Moving averages for trend identification
- 2. RSI for momentum and overbought/oversold conditions
- 3. MACD for trend shifts and momentum confirmation
- 4. Bollinger Bands for volatility context
- 5. Volume and Volume Profile for participation confirmation
- 6. Keltner Channels for breakout confirmation
- 7. CCI for extreme condition detection
- 8. VWAP for institutional price reference
- 9. Stochastic RSI for pullback timing
- 10. Market Facilitation Index for filtering fake moves
- Comparing the top indicators side by side
- How to build your indicator stack by trading style
- My honest take on building a gold indicator setup
- Take your gold trading further with FxShop24
- FAQ
Key takeaways
| Point | Details |
|---|---|
| Gold needs specialized indicators | Gold’s volatility and momentum behavior require adjusted settings beyond standard defaults. |
| Cover all three indicator roles | Use tools across trend, momentum, and volatility categories to avoid blind spots. |
| Combine, don’t stack randomly | Pairing indicators from different categories reduces redundancy and cuts false signals. |
| Match indicators to your style | Intraday, swing, and position traders each need a different indicator configuration. |
| Volume confirms everything | Oscillator signals without volume backing are the most common source of bad entries. |
How to select gold trading indicators that actually work
Before you add a single indicator to your chart, you need a framework. Most traders skip this step and end up with five tools that all say the same thing, or worse, contradict each other with no way to resolve the conflict.
Think of indicators in four job categories:
- Trend filtering: Tells you the dominant direction so you trade with the flow, not against it
- Momentum timing: Signals when a move has energy behind it or when it’s running out of steam
- Volatility context: Shows whether price is in a tight range or expanding, which changes your entry and stop logic entirely
- Support and resistance: Identifies price levels where the market has previously responded
A well-built gold setup has at least one indicator from each category. The role of indicators in trading matters as much as which specific indicator you pick. Two RSI variants, for example, tell you the same story twice and give you false confidence.
Gold’s behavior also demands that you adjust default settings. Gold momentum often extends longer than typical oscillator behavior, which means standard 70/30 RSI levels will fire early and get you stopped out on perfectly valid trends.
Pro Tip: Before adding any new indicator, ask yourself: “Does this tell me something my existing tools don’t?” If the answer is no, leave it off the chart.
Timeframe matters too. A 200-period moving average on a 5-minute chart is nearly useless for context. Match your indicator settings to your actual trading timeframe and the decisions you’re making.
1. Moving averages for trend identification
Moving averages are the backbone of most gold setups, and for good reason. Institutional volume dominates gold markets on higher timeframes, and moving averages reflect where that institutional activity has been concentrated.
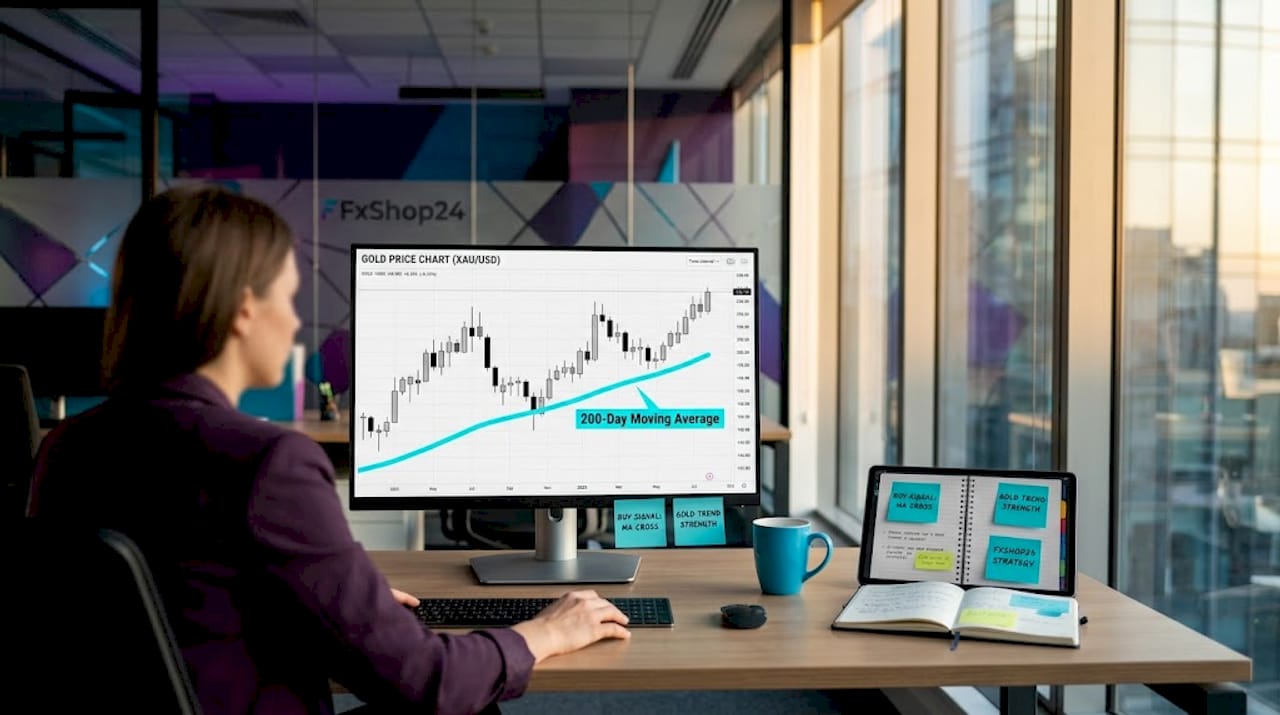
The 200-day MA is the most watched line in gold. Price trading above it signals a long-term bullish bias. Below it, the bias flips bearish. For swing traders, the 50-period MA on the daily chart adds a medium-term filter. Day traders often use the 20 and 50 EMA on the 1-hour or 4-hour chart to track short-term momentum shifts.
Use moving averages to define bias, not to time entries. A crossover of the 20 EMA above the 50 EMA doesn’t mean you buy immediately. It means the trend has shifted and you look for pullback entries confirmed by other tools.
2. RSI for momentum and overbought/oversold conditions
The Relative Strength Index is one of the best gold trading indicators for measuring momentum, but most traders use it wrong. Standard 70/30 settings work fine for ranging markets. In trending gold conditions, price can stay “overbought” for days while continuing to run.
Adjust your RSI levels to 80/20 during high-volatility periods or strong trends. This stops the indicator from generating premature reversal signals when gold is simply in a powerful directional move. RSI divergence, where price makes a new high but RSI doesn’t, is one of the most reliable early warnings of trend exhaustion in gold.
A 14-period RSI on the 4-hour chart is a solid starting point for swing traders. Day traders often drop to a 9-period setting for faster response.
3. MACD for trend shifts and momentum confirmation
MACD gives you two things at once: trend direction and momentum strength. The MACD highlights momentum changes before they become visible on raw price, which makes it genuinely useful for catching early trend shifts in gold.
Watch for three signals: the MACD line crossing above the signal line (bullish), the histogram shrinking toward zero (momentum fading), and divergence between MACD and price. The histogram is particularly useful. When it’s expanding, the trend has conviction. When it’s contracting, start tightening your stops.
MACD is less reliable in sideways gold markets. When price is chopping between support and resistance, MACD crossovers generate noise. Use it in combination with a trend filter like the 200 MA to avoid trading MACD signals in low-conviction conditions.
4. Bollinger Bands for volatility context
Bollinger Bands show you whether gold is in a compression phase or an expansion phase. When the bands narrow, the market is coiling. When they widen sharply, a breakout is already underway.
The best starting point for gold combines moving averages, RSI, and Bollinger Bands because each one covers a different job with no overlap. Bollinger Bands don’t tell you direction. They tell you when the market is moving with force and when it’s likely to revert. Price touching the upper band in an uptrend is not automatically a sell signal. It’s a sign of momentum. Context from RSI and the trend filter determines what to do with that information.
Learn more about using Bollinger Bands in volatile markets to understand how to read band squeezes and expansions correctly before applying them to gold.
5. Volume and Volume Profile for participation confirmation
Volume is the most underused gold price analysis tool among retail traders. Combining oscillators with volatility bands then validating moves with volume is what separates high-quality setups from noise.
A breakout on low volume in gold is almost always a trap. A breakout on expanding volume means real participation is behind the move. Volume Profile takes this further by showing you where the most trading activity has occurred at specific price levels, creating high-volume nodes that act as strong support and resistance.
Pro Tip: If RSI and MACD both signal a buy but volume is declining, wait. The move lacks conviction and the risk of a reversal is significantly higher.
6. Keltner Channels for breakout confirmation
Keltner Channels are the smoother alternative to Bollinger Bands. Where Bollinger Bands use standard deviation, Keltner Channels use Average True Range as their base, which makes them less reactive to single sharp spikes in gold.
Price closing above the upper Keltner band signals a genuine breakout rather than just a volatility spike. This makes Keltner Channels particularly useful on the 4-hour chart for catching gold’s sustained directional moves. Keltner Channels provide more stable volatility bands compared to Bollinger Bands in choppy gold markets, which is exactly why experienced traders keep both on their charts for different purposes.
Don’t use them interchangeably. Bollinger Bands excel at identifying volatility compression before a move. Keltner Channels excel at confirming that a breakout has real follow-through.
7. CCI for extreme condition detection
The Commodity Channel Index measures how far price has deviated from its statistical average. Readings above +100 and below -100 signal potential exhaustion or entry timing, making CCI useful for spotting when gold has stretched too far in one direction.
CCI works best in ranging conditions where gold is cycling between support and resistance. In strongly trending markets, CCI can stay extreme for extended periods, so you need a trend filter before acting on its signals. The key insight: wait for meaningful CCI crosses back through the +100 or -100 level rather than acting the moment it reaches the extreme. That cross back is the actual signal.
8. VWAP for institutional price reference
VWAP (Volume Weighted Average Price) tells you the average price at which gold has traded, weighted by volume. Price above VWAP signals buying dominance while price below signals selling pressure, making it a dynamic benchmark for intraday traders.
Institutions use VWAP as a benchmark for execution quality. When price pulls back to VWAP in an uptrend and holds, that’s a high-probability long setup because you’re buying at a price level that large players consider fair value. VWAP resets daily, so it’s most relevant for day traders and short-term swing traders rather than position traders.
9. Stochastic RSI for pullback timing
Stochastic RSI applies the Stochastic formula to RSI values rather than price, making it significantly faster and more sensitive than standard RSI. This speed makes it useful for timing entries on pullbacks within established gold trends.
When gold is in an uptrend confirmed by the 50 or 200 MA, a Stochastic RSI reading below 20 on the 1-hour chart signals that a short-term pullback has reached oversold territory. That’s your entry window. The risk is that Stochastic RSI generates many false signals in choppy conditions, so it should only be used when a clear trend is already established by a higher-timeframe indicator.
10. Market Facilitation Index for filtering fake moves
The Market Facilitation Index (MFI) measures how efficiently price is moving relative to volume. A rising MFI with rising volume means the market is moving with purpose. A rising MFI with falling volume suggests the move may not sustain.
MFI is used alongside volume to filter low-quality setups and protect capital in chaotic gold market conditions. Gold is particularly prone to sharp, news-driven spikes that look like breakouts but reverse immediately. MFI helps you distinguish between a real directional move and a volume-less spike that will fade.
Comparing the top indicators side by side
| Indicator | Main function | Best timeframe | Strength | Weakness |
|---|---|---|---|---|
| Moving Average | Trend direction | Daily, 4H | Simple, reliable bias | Lags price |
| RSI | Momentum/exhaustion | 4H, 1H | Divergence signals | Fires early in trends |
| MACD | Trend shifts | 4H, Daily | Early momentum warning | Noisy in ranges |
| Bollinger Bands | Volatility context | Any | Compression detection | No directional bias |
| Volume/VP | Participation | Any | Confirms real moves | Not available on all platforms |
| Keltner Channels | Breakout confirmation | 4H | Smoother than BB | Slower to react |
| CCI | Extreme conditions | 1H, 4H | Ranging markets | Stays extreme in trends |
| VWAP | Institutional value | Intraday | Institutional benchmark | Resets daily |
| Stochastic RSI | Pullback timing | 1H, 15M | Fast response | Many false signals |
| MFI | Move quality | Any | Filters fake breakouts | Requires volume data |
Pro Tip: Never use two indicators from the same category, such as both CCI and RSI, without a clear reason. They’ll mostly agree, which feels reassuring but adds nothing to your edge.
How to build your indicator stack by trading style
The right combination depends entirely on what kind of trader you are. Here’s a practical starting point for each style:
Intraday traders (scalping and day trading):
- VWAP as the session bias anchor
- Stochastic RSI for entry timing on pullbacks
- Keltner Channels for breakout confirmation
- Volume for participation validation
Swing traders (holding for days to weeks):
- 50 and 200 MA on the daily chart for trend bias
- RSI (adjusted to 80/20 in trending conditions) for momentum
- Bollinger Bands for volatility context
- MACD for trend shift confirmation
Position traders (weeks to months):
- 200-day MA as the primary trend filter
- MACD on the weekly chart for major momentum shifts
- Volume Profile for identifying key long-term price levels
The most common mistake is indicator overload. More indicators do not mean more certainty. They mean more conflicting signals and slower decisions. Start with three indicators covering trend, momentum, and volatility. Add a fourth only when you have a specific gap in your analysis that it fills.
Disciplined risk management sits alongside your indicator setup, not inside it. Indicators tell you when to trade. Position sizing and stop placement determine whether you survive long enough to benefit from being right.
My honest take on building a gold indicator setup
I’ve seen traders spend weeks testing every indicator combination imaginable, only to end up with a chart so cluttered they can’t make a decision under pressure. The traders who actually perform consistently tend to use fewer tools, not more.
What I’ve learned is that the biggest mistakes aren’t about picking the wrong indicator. They’re about misusing a good one. RSI is a perfect example. Traders see 70 and immediately think “sell.” In a strong gold uptrend, that instinct costs them trade after trade. Adjusting RSI to 80/20 during high-volatility regimes isn’t a tweak. It’s the difference between the indicator working and not working.
The other pattern I see constantly is treating volatility bands as directional signals. Bollinger Bands and Keltner Channels tell you how price is moving, not where it’s going. Confusing those two things produces entries that feel logical but are actually just guesses dressed up in indicator language.
My practical advice: build a playbook, not a setup. Document the specific conditions under which each indicator in your stack gives a reliable signal for gold. Note the timeframe, the volatility regime, and what confirmation you need. That document becomes more valuable than any indicator combination you could copy from someone else.
Gold’s volatility regime changes. A setup that works beautifully during a trending month may generate nothing but noise during a consolidation phase. The traders who adapt their indicator parameters to current conditions outperform those who treat their setup as permanent.
— FxShop24
Take your gold trading further with FxShop24
Understanding the top indicators for gold is the foundation. Putting them to work consistently, without emotional interference or missed signals, is where most traders struggle.
At Fxshop24, we’ve built a library of expert advisors and automated tools for MT4 and MT5 that incorporate the very indicators covered in this guide. Whether you want a fully automated futures trading system that handles signal execution for you, or you’re exploring the types of automated trading systems that best fit your gold strategy, Fxshop24 has tested, prop-firm-ready solutions built for serious traders. Browse our full catalog at fxshop24.net and find the tools that match the indicator logic you’ve just learned.
FAQ
What are the best indicators for gold trading?
The best gold trading indicators include Moving Averages, RSI, MACD, Bollinger Bands, and Volume, used together to cover trend, momentum, and volatility analysis.
Should I adjust RSI settings for gold?
Yes. Gold’s momentum often extends beyond standard oscillator behavior, so many traders use 80/20 RSI levels instead of the default 70/30 during trending or high-volatility conditions.
What is the difference between Bollinger Bands and Keltner Channels?
Bollinger Bands use standard deviation and excel at detecting volatility compression before a move. Keltner Channels use ATR and are better for confirming that a breakout has genuine follow-through.
How many indicators should I use for gold trading?
Three to four indicators covering different roles (trend, momentum, volatility) is the practical sweet spot. More than that typically creates conflicting signals rather than additional clarity.
Why is volume important in gold trading?
Pure oscillator signals without volume confirmation are a leading cause of false entries. Volume validates whether a price move has real participation behind it or is likely to reverse.