


20
Jun
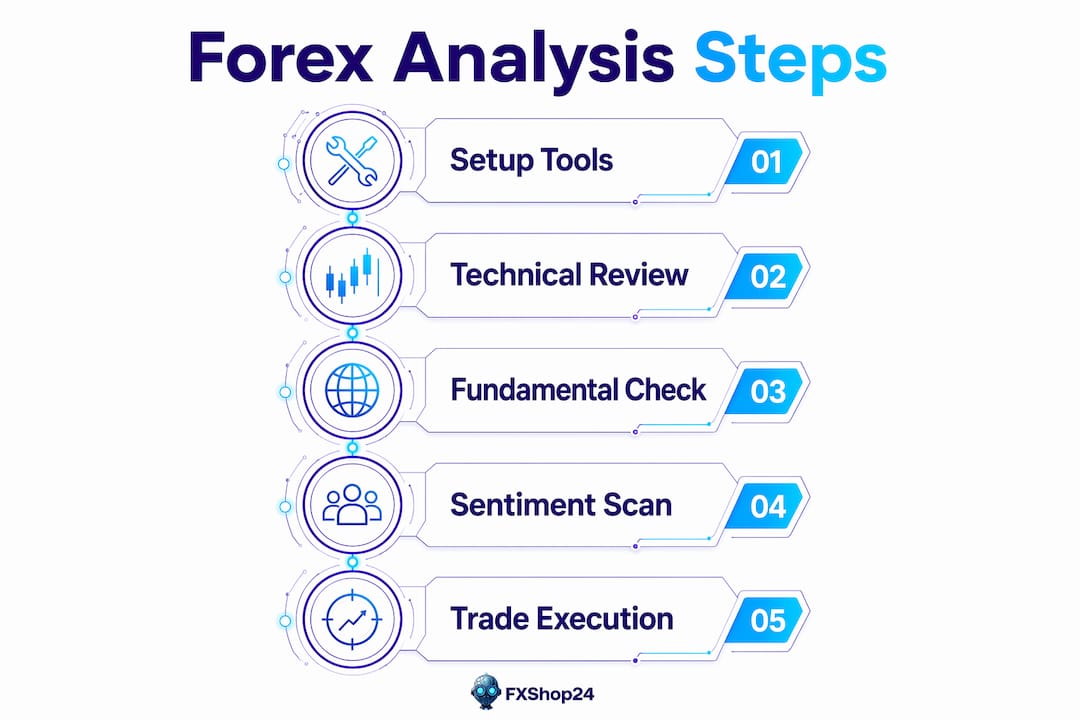
Step by Step Forex Analysis: Your 2026 Trading Guide
TL;DR:
- Step-by-step forex analysis combines technical, fundamental, and sentiment insights to identify high-confidence trades.
- Most traders focus heavily on technicals, ignoring how macro factors and market sentiment influence price movement.
Step by step forex analysis is a structured process that combines technical chart reading, fundamental economic evaluation, and sentiment insights to identify and execute high-conviction trades. The forex market processes over $7.5 trillion in daily volume, making it the largest financial market on earth. That scale means opportunity, but also noise. Without a repeatable analysis framework, most retail traders react to price instead of anticipating it. This guide gives you the exact process, tools, and mental model to analyze any currency pair with clarity and confidence.
What are the essential tools and prerequisites for forex analysis?
The right setup separates traders who guess from traders who decide. Before you run a single analysis, you need three categories of tools in place: a charting platform, a data feed, and a review system.
Charting platforms
MetaTrader 4 (MT4) and MetaTrader 5 (MT5) are the industry standard platforms for retail forex traders. MT5 adds depth-of-market data and more built-in timeframes compared to MT4. cTrader is a strong alternative, particularly for traders who want a cleaner interface and Level II pricing. All three support custom indicators, which matters when you start building a repeatable forex strategy process.
Data and research tools
Your analysis is only as good as your data. Every serious trader needs these five tools running before markets open:
- Economic calendar (Forex Factory or Investing.com) to track scheduled data releases
- News feed (Reuters or Bloomberg) for real-time macro context
- Sentiment data (CFTC Commitment of Traders reports, broker positioning dashboards)
- Multi-timeframe chart setup with at least three timeframes loaded per pair
- Trading journal (Edgewonk or a structured spreadsheet) to log every trade decision
| Tool Category | Recommended Options | Primary Use |
|---|---|---|
| Charting platform | MT4, MT5, cTrader | Price action and indicator analysis |
| Economic calendar | Forex Factory, Investing.com | Scheduling around high-impact events |
| Sentiment data | CFTC COT, broker dashboards | Positioning and crowd psychology |
| Trading journal | Edgewonk, spreadsheet | Performance review and improvement |
Pro Tip: Open a demo account on MT4 or MT5 before risking live capital. Demo trading lets you practice the full analysis workflow, including entry, stop placement, and journaling, without financial consequences.
Historical data access matters too. Most platforms store years of tick and bar data. Pull at least 12 months of weekly candles before analyzing any pair. This gives you enough context to identify major swing levels and long-term trend structure.
How to conduct technical analysis step by step
Technical analysis for forex is built on one core principle: price action on higher timeframes overrides signals on lower timeframes. This is called top-down analysis, and it is the framework professional traders use to filter out noise and stay aligned with the dominant market direction.
Follow these steps in order:
Start on the weekly chart. Identify the dominant trend using swing highs and swing lows. A series of higher highs and higher lows confirms an uptrend. Mark the most significant support and resistance zones at this timeframe. These are your macro anchors.
Drop to the daily chart. Confirm the weekly trend direction. Add a 50-period and 200-period moving average. Price trading above both moving averages in an uptrend confirms bullish bias. Look for key daily levels that align with your weekly zones.
Move to the 4-hour or 1-hour chart. This is where you identify trade structure and refine your zones. Look for consolidation areas, breakout points, and trend continuation patterns such as bull flags or ascending triangles.
Use the 15-minute or 5-minute chart for entry triggers only. Never form your directional bias at this level. Use it to time entries with precision once higher timeframes agree.
The three-timeframe hierarchy of weekly/daily, 4H/1H, and 15M/5M gives you macro direction, structural zones, and precise entry points in one repeatable sequence.
Drawing support and resistance correctly

Most beginners draw support and resistance as exact lines. That is the wrong approach. Support and resistance zones span roughly 10–15 pips wide because price reacts to areas, not single price points. Drawing zones instead of lines dramatically reduces premature stop-outs. Use the body-to-wick range of multiple candles that cluster near the same level to define your zone boundaries.
Indicator selection and momentum reading
Professional traders use one trend indicator, one momentum oscillator, and one volatility measure. Adding more indicators creates conflicting signals, not clarity. A practical baseline setup is a 200-period moving average for trend, RSI for momentum, and Average True Range (ATR) for volatility context.
Use RSI for divergence detection, not just overbought or oversold readings. In a strong uptrend, RSI can stay above 70 for weeks. That alone is not a sell signal. When price makes a new high but RSI makes a lower high, that divergence signals weakening momentum and a potential reversal.
| Indicator | Best Use | Common Mistake |
|---|---|---|
| 200-period MA | Trend direction filter | Using it as a dynamic support/resistance line alone |
| RSI (14) | Divergence detection | Selling every time RSI hits 70 |
| ATR (14) | Stop loss sizing | Ignoring it entirely |
| MACD | Momentum confirmation | Using crossovers as standalone entry signals |
Pro Tip: Set your stop loss below the nearest structural level, not at a fixed pip distance. Structure-based stops align with how the market actually moves and give your trade room to breathe.
How to perform fundamental analysis step by step
Fundamental analysis in forex is the process of comparing the relative economic strength of two countries to form a directional bias on their currency pair. The key word is relative. You are not asking whether the U.S. economy is strong. You are asking whether it is stronger than the Eurozone economy right now, and whether that gap is widening or narrowing.
Work through these five macro pillars in order for each currency in the pair:
Inflation trajectory. Is inflation rising, falling, or stable? Central banks like the Federal Reserve and the European Central Bank respond to inflation with rate decisions. Rising inflation typically leads to rate hikes, which attract capital and strengthen the currency.
Growth outlook. GDP growth, PMI readings, and retail sales data reveal economic momentum. A country with accelerating growth tends to see currency appreciation as investment flows increase.
Labor market health. Non-Farm Payrolls (NFP) in the United States, the UK’s claimant count, and Eurozone employment data signal consumer spending power and central bank confidence.
External balances. Trade surplus or deficit data shows whether a country is a net exporter or importer of capital. Persistent trade surpluses, as seen historically with Japan and Germany, tend to support currency strength.
Central bank policy trajectory. This is the most market-moving pillar. Fundamental analysis must be anchored to policy expectations, not just current rates. A central bank that signals future rate cuts is more bearish for its currency than one already at a low rate but signaling hikes.
Once you have scored both currencies across these pillars, you have a directional bias. That bias tells you which side of the trade to look for on your technical charts.
Key practices for managing event risk:
- Mark all Tier 1 data releases on your economic calendar at the start of each week
- Avoid entering new positions 30 minutes before high-impact releases
- After a release, wait for the initial volatility spike to settle before acting on the new data
- Reassess your fundamental bias monthly as new data updates the picture
How does sentiment analysis sharpen your trade decisions?
Sentiment analysis measures what market participants are actually doing, not what they say they will do. It is the third layer of a complete forex analysis framework, and it often catches what technical and fundamental analysis miss.
The primary sentiment tools used by professional traders are:
- CFTC Commitment of Traders (COT) reports: Published weekly, these show net positioning of large speculators (hedge funds) and commercial hedgers in futures markets. Extreme net long or short positioning often precedes reversals.
- Retail broker positioning data: Platforms like IG and Oanda publish the percentage of their retail clients who are long versus short. Retail traders are historically wrong at extremes, making this a contrarian signal.
- Flow indicators: Order flow data and volume analysis show where real money is entering and exiting the market.
Sentiment acts as an early warning system. When price breaks above a key resistance level but COT data shows speculators are already at historically extreme long positions, that breakout is suspect. The fuel for further upside may already be exhausted. Sentiment divergence from price action is one of the most reliable signals that a technical move lacks follow-through.
Build a weekly sentiment check into your routine. Every Sunday before markets open, review the latest COT report and your broker’s retail positioning data for the pairs you trade. Flag any extreme readings and note them alongside your technical and fundamental bias.
Pro Tip: When your technical setup, fundamental bias, and sentiment reading all point in the same direction, that is your highest-conviction trade. Wait for that alignment before sizing up.
What is the stepwise workflow for executing trades?
Analysis without execution is just research. The final step is converting your three-layer analysis into a structured trade plan and then managing it with discipline.
Follow this execution sequence:
Build a ranked watchlist. List the pairs where technical, fundamental, and sentiment analysis align. Rank them by conviction level. Only trade the top one or two setups each week.
Calculate position size before entry. The 1–2% risk rule means you never risk more than 1–2% of your account on a single trade. Calculate your position size based on the distance from your entry to your stop loss, not on how confident you feel.
Define your entry, stop, and target before placing the order. Your stop goes below the nearest structural level. Your target should offer at least a 1:2 risk-to-reward ratio. If the math does not work, skip the trade.
Manage the trade without interference. Once in a trade, your job is to follow the plan. Moving stops prematurely or closing early out of fear destroys the statistical edge your analysis created.
Log every trade in your journal. Record the setup type, your analysis reasoning, entry and exit prices, and the outcome. Trading journals are the single most effective tool for identifying patterns in your own decision-making and improving over time.
For long-term risk management, treat your trading capital like a business asset. Drawdown limits, weekly loss caps, and position sizing rules protect you from the emotional decisions that destroy accounts.
Key Takeaways
Consistent forex trading performance requires integrating technical, fundamental, and sentiment analysis into a single repeatable workflow anchored by strict risk management.
| Point | Details |
|---|---|
| Use top-down analysis | Start on weekly charts for direction, then drill to 15M charts for entry timing only. |
| Draw zones, not lines | Mark support and resistance as 10–15 pip zones to reduce stop-outs from price noise. |
| Score both currencies fundamentally | Compare inflation, growth, labor, and central bank policy for each currency in the pair. |
| Apply the 1–2% risk rule | Never risk more than 2% of account capital on any single trade, regardless of conviction. |
| Journal every trade | Systematic review of your trade log is the fastest path to identifying and fixing weaknesses. |
Why most traders skip the hardest part of forex analysis
After years of working with retail traders and building tools at Fxshop24, I have noticed a consistent pattern. Most traders spend 90% of their time on technical analysis and almost none on fundamental or sentiment context. They find a clean chart pattern, enter, and then wonder why the trade fails when a central bank statement reverses the move in seconds.
The uncomfortable truth is that technical analysis alone is a coin flip in many market conditions. The edge comes from knowing why price is likely to move, not just where it might move. When your fundamental bias, your chart structure, and your sentiment reading all point the same direction, you are not guessing. You are trading with a genuine edge.
I also see traders stack five or six indicators on a chart and call it analysis. That is noise management, not analysis. A clean chart with one trend filter, one momentum oscillator, and clearly drawn zones tells you more than a cluttered screen ever will.
The other habit that separates improving traders from stagnant ones is the journal. Not a vague log of wins and losses, but a structured record of why you took each trade, what the setup looked like, and what actually happened. Review it weekly. The patterns in your own mistakes are more valuable than any indicator.
Start on a demo account. Build the workflow. Then trade live with small size until the process feels automatic. Discipline in the process is what creates consistent results, not the perfect setup.
— Fxshop24
Take your analysis further with Fxshop24
Solid analysis is the foundation. The right tools make execution faster and more consistent.
Fxshop24 offers a curated library of expert advisors, trading indicators, and automated trading systems built for MT4 and MT5. Whether you want to automate your entry rules after completing your weekly analysis or explore trading software types that complement your manual process, the platform has tested, prop firm-ready tools with lifetime updates. Every product comes with installation support and detailed performance data so you can evaluate fit before committing. Explore the full catalog at Fxshop24 and find the tools that match your trading style.
FAQ
What is step by step forex analysis?
Step by step forex analysis is a structured method that combines technical chart reading, fundamental economic comparison, and sentiment positioning data to identify high-probability trade setups. It follows a top-down sequence from higher timeframes to lower timeframes before any trade is placed.
How many timeframes should I use for forex analysis?
The standard professional approach uses three timeframes: weekly or daily for macro direction, 4-hour or 1-hour for structure and zones, and 15-minute or 5-minute for precise entry triggers. Using more than three timeframes typically creates confusion rather than clarity.
What is the best indicator setup for beginner forex analysis?
A balanced setup uses one trend indicator such as a 200-period moving average, one momentum oscillator such as RSI set to 14 periods, and one volatility measure such as ATR. Indicator stacking beyond this creates conflicting signals and reduces chart clarity.
How much should I risk per forex trade?
The professional standard is the 1–2% risk rule: never risk more than 1–2% of your total account capital on any single trade. This rule protects your account during losing streaks and keeps you in the game long enough to benefit from your analysis edge.
How does sentiment analysis help in forex trading?
Sentiment analysis uses tools like the CFTC COT report and retail broker positioning data to reveal what market participants are actually doing with their money. Extreme positioning often signals that a trend is near exhaustion, giving you an early warning before a technical reversal confirms it.