


25
Jun
Tutorial on Optimizing Trading Results That Actually Work
TL;DR:
- Proper trading strategy optimization involves systematic backtesting, walk-forward validation, and evaluating multiple performance metrics to ensure durability in live markets.
- Avoid overfitting by using a 70/30 data split, broad parameter ranges, and simple strategies with sufficient trades, while confirming stability through plateau testing and out-of-sample analysis.
Trading strategy optimization is the process of systematically refining your strategy’s parameters through backtesting and validation to produce consistent, profitable results in forex and gold markets. Most traders treat optimization as a one-time fix. The ones who profit consistently treat it as a repeatable process. This tutorial on optimizing trading results covers the full workflow: defining what to optimize, running backtests, applying walk-forward validation, and tuning risk parameters. You will work with tools like MetaTrader 4 (MT4), MetaTrader 5 (MT5), and key metrics including profit factor and the Sharpe ratio.
What is trading system optimization and why does it matter?
Trading system optimization is the systematic adjustment of strategy parameters to improve measurable performance metrics across historical and out-of-sample data. The industry term is “parameter optimization,” and it sits at the core of any serious backtesting workflow. Done correctly, it separates strategies with genuine edges from ones that just got lucky on a specific data set.
The role of optimization in trading is not to find perfect settings. It is to identify parameter ranges that produce stable, repeatable results. That distinction matters enormously. A strategy tuned to perfection on past data almost always fails on new data because it has learned the noise, not the signal.
Two metrics define whether your optimization is working:
- Profit factor (PF): Gross profit divided by gross loss. Realistic backtested strategies show PF values between 1.2 and 2.0. Any PF above 3.0 demands scrutiny. It usually signals overfitting or a sample size too small to be meaningful.
- Sharpe ratio: Risk-adjusted return. A Sharpe above 1.0 is acceptable; above 2.0 is strong for a forex or gold system.
Common pitfalls include optimizing too many parameters at once, ignoring trade sample size, and treating a single backtest as proof of edge. Each of these errors inflates your in-sample results while destroying live performance.
Pro Tip: Never optimize more than three parameters simultaneously. Each additional parameter multiplies the risk of curve-fitting exponentially.
How to set up and prepare for effective trading optimization
Preparation determines whether your optimization produces real insight or false confidence. The three pillars are data quality, parameter selection, and software setup.

Choosing your data and parameters
Use at least five years of tick data for forex pairs like EUR/USD or for gold (XAU/USD). Shorter histories miss full market cycles including trending, ranging, and volatile regimes. Choose parameters that have a logical basis in market behavior. RSI period, ATR multiplier for stop-loss, and moving average length are all defensible choices. Avoid optimizing parameters that have no theoretical grounding.
Splitting your data correctly
The standard split for honest testing is 70% for optimization and 30% reserved for out-of-sample testing. The optimizer never sees that 30%. This holdout set is your only honest measure of real-world performance. Violating this rule by peeking at the holdout set converts it into another optimization loop.
One technical detail most traders miss: indicator warm-up periods must be accounted for before each optimization window begins. Failing to do so either wastes historical data or leaks future information into your calculations.
Software and tools overview
| Tool | Primary use | Platform |
|---|---|---|
| MT4 Strategy Tester | Backtest and parameter grid search | MetaTrader 4 |
| MT5 Strategy Tester | Multi-currency and multi-asset testing | MetaTrader 5 |
| StratBase.ai | Walk-forward analysis and reporting | Web-based |
| Python (pandas, backtrader) | Custom optimization and scripting | Cross-platform |
Pro Tip: Always run your initial backtest on the full data set first to confirm the strategy has any edge at all before spending time on parameter optimization.
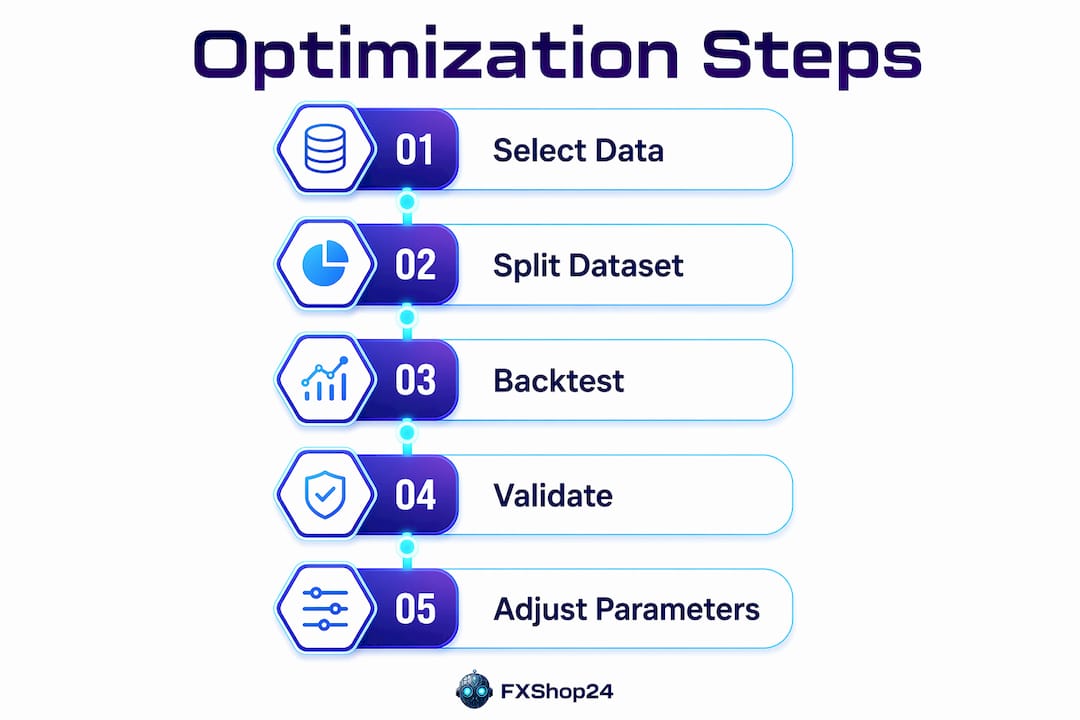
How to optimize trading strategies step by step
This is the core of any tutorial on improving trading outcomes. Follow this sequence without skipping steps.
Define your optimization objective. Choose one primary metric to optimize. Profit factor is the most common starting point. Do not optimize for net profit alone. It ignores drawdown and trade frequency entirely.
Run a baseline backtest. Test your strategy with default parameters on the full historical data set. Record profit factor, Sharpe ratio, maximum drawdown, and total trade count. This is your benchmark.
Set parameter ranges. For each parameter you plan to optimize, define a minimum, maximum, and step size. Example: RSI period from 8 to 21 in steps of 1. Stop-loss from 1.0 to 3.0 ATR in steps of 0.25. Keep ranges logically bounded.
Run a grid search. MT4 and MT5 both support exhaustive grid searches through the Strategy Tester. Every combination within your defined ranges gets tested. The output is a matrix of results across all parameter combinations.
Evaluate using multiple metrics. Never select parameters based on one number. Review profit factor, Sharpe ratio, and maximum drawdown together. Optimization results require a full picture including drawdowns, stability across windows, and psychological factors like win rate.
Apply the plateau test. Look at the parameter surface around your best result. Robust strategies show broad plateaus of stable performance rather than sharp isolated peaks. A narrow spike in the parameter grid means the strategy is fragile. One tick of difference in your RSI period should not cut your profit factor in half.
Run walk-forward analysis. Walk-forward analysis partitions historical data into sequential windows. Each window optimizes on an in-sample segment and then tests on the following out-of-sample segment. The process rolls forward until all data is used. This mimics real-time re-optimization and is the preferred validation method among institutional quantitative teams.
Interpret Walk-Forward Efficiency (WFE). WFE compares average annual returns on out-of-sample segments versus in-sample segments. A WFE near 1.0 indicates strong generalization. A WFE near 0.5 signals poor persistence. Anything below 0.4 means the strategy is not generalizing and should be revised or discarded.
In-sample vs. out-of-sample performance comparison
| Metric | In-sample target | Out-of-sample minimum |
|---|---|---|
| Profit factor | 1.5–2.5 | 1.2+ |
| Sharpe ratio | 1.5+ | 1.0+ |
| Max drawdown | Below 20% | Below 25% |
| WFE ratio | N/A | 0.7+ |
How to identify and avoid overfitting in your strategy
Overfitting is the single biggest reason optimized strategies fail in live trading. A strategy that performs well in-sample but collapses out-of-sample carries a clear overfitting signature. Strategies tuned on the same data they are tested on capture noise, not genuine market edge.
Watch for these warning signs:
- Sharp drop in Sharpe ratio from in-sample to out-of-sample. A Sharpe of 2.5 in-sample dropping to 0.4 out-of-sample is a red flag, not a minor variance.
- Extremely high profit factor. As noted, PF above 3.0 almost always signals over-optimization or a sample too small to be statistically valid.
- Low trade count. A strategy with 30 trades in a five-year backtest cannot produce statistically meaningful results. Aim for at least 200 trades across the test period.
- Narrow parameter peaks. If only one exact RSI value produces good results and every adjacent value fails, the strategy has no real edge.
- Meta-optimization. This is the trap of repeatedly adjusting your optimization setup itself, such as changing window sizes or selection criteria, until the out-of-sample results look good. It converts your holdout data into another optimization target.
Repeated testing on the same out-of-sample data without fresh samples causes invalid results and false confidence. Once you use the holdout set to make a decision, it is no longer out-of-sample. Treat it as spent.
A strategy that looks perfect in backtesting but has never been tested on data the optimizer never saw is not a strategy. It is a memory.
The fix is simplicity. Fewer parameters, wider ranges, and larger trade samples all reduce overfitting risk. A three-parameter strategy with 500 trades across five years of data is far more trustworthy than a ten-parameter strategy with 80 trades.
How to optimize risk management parameters for better net results
Entry signal validation comes first. Do not touch stop-loss or take-profit levels until you have confirmed that your entry logic produces a positive edge on its own. Optimizing SL and TP on a broken entry signal only masks the underlying problem.
Once your entry is validated, run a grid search across SL and TP levels using ATR multiples. ATR-based levels adapt to market volatility, which makes them far more durable than fixed pip values. A practical grid might test SL from 1.0 to 3.0 ATR and TP from 1.5 to 5.0 ATR in 0.25 steps.
Evaluate each combination using all four metrics:
- Profit factor for overall edge quality
- Sharpe ratio for risk-adjusted consistency
- Maximum drawdown for worst-case exposure
- Win rate for psychological sustainability
Win rate and profit factor often trade off against each other. A high win rate with a low profit factor means your winners are small and your losers are large. That setup is psychologically comfortable but mathematically fragile. A lower win rate with a high profit factor is often more durable, but requires discipline to hold through losing streaks.
Pro Tip: For gold (XAU/USD) specifically, ATR values are significantly larger than for major forex pairs. Always recalibrate your ATR multiplier ranges when switching between instruments.
You can find a detailed breakdown of risk parameter management that covers position sizing alongside SL and TP tuning.
Key Takeaways
Effective trading strategy optimization requires systematic backtesting, walk-forward validation, and multi-metric evaluation to produce results that hold up in live markets.
| Point | Details |
|---|---|
| Use a 70/30 data split | Reserve 30% of historical data as a holdout set the optimizer never sees. |
| Target PF between 1.2 and 2.0 | Profit factor above 3.0 signals overfitting, not genuine edge. |
| Apply walk-forward analysis | Sequential in-sample and out-of-sample windows validate real-world durability. |
| Check the plateau test | Broad stable parameter ranges indicate a real edge; narrow spikes indicate fragility. |
| Optimize SL/TP after entry validation | Confirm your entry signal works before tuning risk management parameters. |
What I have learned from years of watching traders optimize badly
The most common mistake I see is traders chasing the highest backtest number. They run hundreds of parameter combinations, find the one that produced 400% returns over five years, and call it done. That strategy almost never survives its first month of live trading. The backtest was a memory, not a forecast.
Walk-forward analysis changed how I evaluate every system that comes through Fxshop24. A strategy that shows a WFE of 0.8 across 12 rolling windows is worth far more than one with a perfect in-sample Sharpe and a single out-of-sample test. The rolling structure forces the strategy to prove itself repeatedly, not just once.
The other lesson is that automation does not eliminate the need for judgment. Expert advisors on MT4 and MT5 execute rules without emotion, which is a genuine advantage. But those rules still need to be validated by a human who understands what the numbers actually mean. Automated execution combined with disciplined manual review is the combination that produces durable results. You can explore testing best practices for forex traders to build that review process into your workflow.
— Fxshop24
Fxshop24 tools for traders ready to go further
Fxshop24 offers a full catalog of expert advisors, AI-powered trading robots, and MT4/MT5 trading systems built for forex and gold markets. Every product ships with installation guidance and lifetime updates, so your optimization work does not stop at purchase.
Traders looking to apply the techniques in this guide to a ready-built system can start with the automated futures trading systems marketplace. Each system includes performance documentation and prop firm compatibility details. For traders who want to build their own workflow from scratch, the forex automation setup guide walks through the full process from strategy selection to live deployment on MT4 and MT5.
FAQ
What is trading system optimization?
Trading system optimization is the process of adjusting a strategy’s parameters through backtesting to improve performance metrics like profit factor and Sharpe ratio. The goal is stable, generalizable results rather than a perfect fit to historical data.
How do I avoid overfitting when optimizing a strategy?
Use a 70/30 data split, apply the plateau test to check for broad parameter stability, and validate with walk-forward analysis. Never reuse your out-of-sample holdout set for additional decisions.
What is a good profit factor for a trading strategy?
A profit factor between 1.2 and 2.0 indicates a realistic, well-tested strategy. Values above 3.0 almost always signal overfitting or an insufficient trade sample size.
What is walk-forward efficiency and why does it matter?
Walk-Forward Efficiency (WFE) compares out-of-sample returns to in-sample returns across rolling windows. A WFE near 1.0 confirms strong generalization; a WFE below 0.5 means the strategy is not holding up on new data.
Should I optimize stop-loss and take-profit at the same time as entry parameters?
No. Validate your entry signal first, then run a separate grid search on SL and TP levels using ATR multiples. Mixing both optimizations at once inflates results and makes it impossible to isolate what is actually working.