


31
Oct
How to Backtest Your MT4 EA in 5 Minutes (Complete Verification Guide)
Ever downloaded a promising Expert Advisor only to watch it drain your account within days? You're not alone. Most traders skip the crucial verification step that separates profitable EAs from account killers, proper backtesting.
Here's the reality: Running a 5-minute backtest can save you months of losses and frustration. This guide walks you through the exact process professional traders use to verify their EAs before risking real money.
Why Most Traders Get Backtesting Wrong
Before diving into the process, understand this: backtesting isn't about finding the perfect EA. It's about understanding how your EA behaves under different market conditions and whether its risk profile matches your trading goals.
The biggest mistake? Traders either skip backtesting entirely or run tests without understanding what the results actually mean. This leads to false confidence in EAs that perform well in limited historical periods but fail spectacularly in live markets.
The 5-Minute MT4 Backtest Process
Step 1: Launch Strategy Tester (30 seconds)
Open MetaTrader 4 and access the Strategy Tester using one of these methods:
- Navigate to View > Strategy Tester
- Press Ctrl+R for instant access
- Click the Strategy Tester icon in the toolbar
The Strategy Tester window appears at the bottom of your MT4 platform. If you don't see it, drag the border upward to expand the panel.
Step 2: Configure Basic Settings (90 seconds)
In the Strategy Tester window, make these essential selections:
Expert Advisor Selection: Choose your EA from the first dropdown menu. If your EA doesn't appear, ensure it's properly installed in the Experts folder of your MT4 directory.
Symbol Selection: Pick the currency pair or asset your EA is designed for. Don't test a EUR/USD EA on GBP/JPY, each pair has unique characteristics that affect performance.
Model Selection: Choose your testing precision:
- Every tick (based on all available least timeframes): Most accurate but slower
- 1 minute OHLC: Good balance of speed and accuracy for quick verification
- Open prices only: Fastest but least reliable
For verification purposes, use "1 minute OHLC" to balance accuracy with speed.

Step 3: Set Testing Parameters (90 seconds)
Date Range Configuration: Enable "Use date" and select a meaningful testing period. For quick verification, test 6-12 months of recent data. Avoid cherry-picking favorable periods, include various market conditions.
Leverage and Deposit: Match your actual trading conditions. If you trade with 1:100 leverage and a $1,000 account, input these exact values.
Input Parameters: Click the "Inputs" tab to modify your EA's settings. Key parameters to verify:
- Lot size (start with 0.01 for testing)
- Take Profit and Stop Loss levels
- Risk percentage per trade
- Any indicator-specific settings
Step 4: Execute the Test (60 seconds)
Disable Visual Mode: For speed, keep visual mode unchecked. You can enable it later for detailed analysis.
Start the Test: Click "Start" and watch the progress bar. A 6-month backtest typically completes in 30-60 seconds on modern computers.
Monitor Progress: The "Journal" tab shows real-time testing progress and any errors or warnings.
Step 5: Analyze Results (90 seconds)
Once complete, examine these critical metrics in the "Results" tab:
Profit Factor: Ratio of gross profit to gross loss. Values above 1.3 indicate potentially profitable strategies.
Total Trades: Ensure sufficient trade frequency for statistical significance. Fewer than 30 trades may not provide reliable data.
Winning Percentage: While important, don't focus solely on this metric. A 40% win rate with proper risk management often outperforms 80% win rates with poor risk control.
Maximum Drawdown: Critical for risk assessment. If the maximum drawdown exceeds your risk tolerance, the EA isn't suitable regardless of profitability.
What Good Results Actually Look Like
Understanding result quality prevents costly mistakes. Here's what to look for:
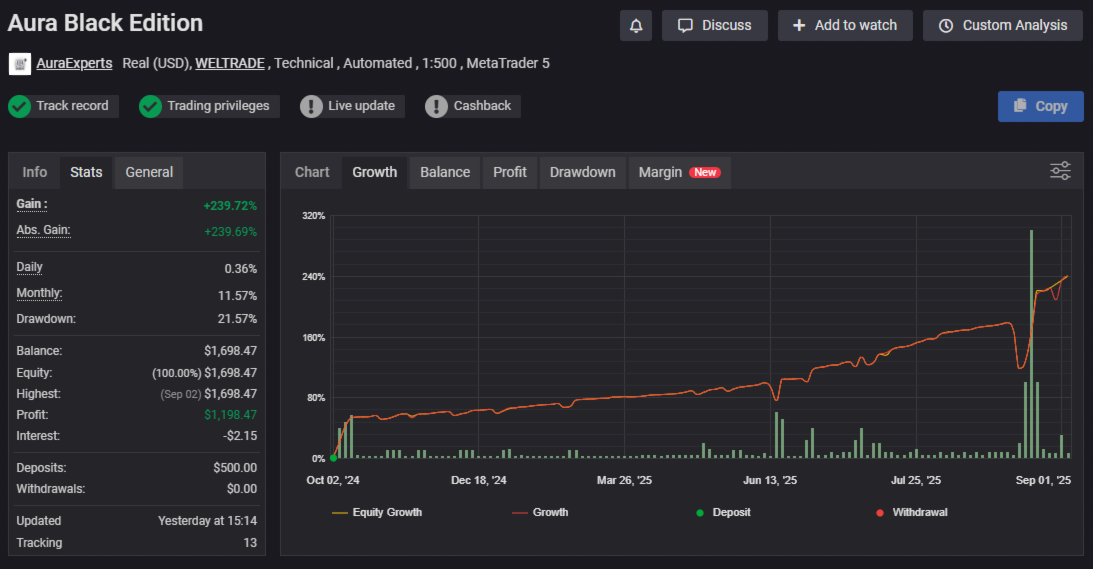
Consistent Performance: Profit should accumulate steadily rather than from a few lucky trades. Check the "Graph" tab for equity curve analysis.
Reasonable Drawdown: Maximum drawdown should stay within acceptable limits. Professional traders typically accept 10-20% maximum drawdown.
Balanced Win/Loss Ratio: Extremely high win rates (above 90%) often indicate curve-fitted EAs that may fail in live markets.
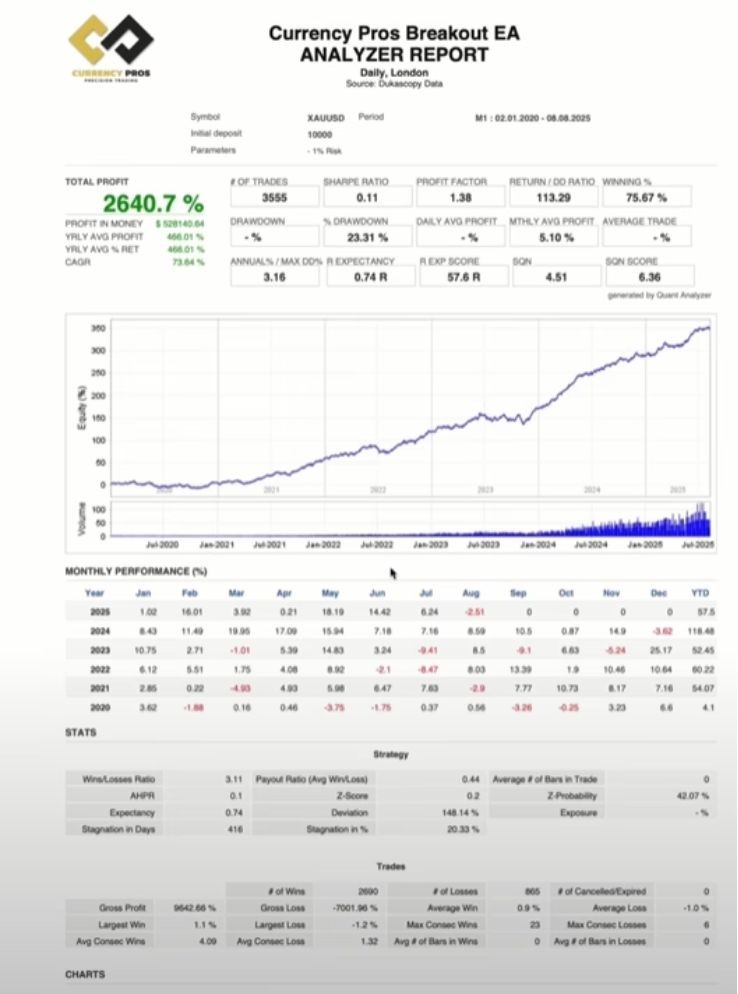
This performance chart shows healthy EA characteristics: steady growth, manageable drawdown periods, and consistent profitability across different market phases.
Common Backtesting Traps to Avoid
Over-Optimization Danger
Never adjust EA parameters based on backtest results alone. This creates curve-fitted systems that perform perfectly on historical data but fail in live trading. According to Investopedia's guide to backtesting, over-optimization is one of the primary reasons backtested strategies fail in live markets.
Limited Time Frame Testing
Testing only bull or bear markets provides skewed results. Include various market conditions: trending, ranging, high volatility, and low volatility periods.
Ignoring Spread and Slippage
MT4's Strategy Tester doesn't perfectly simulate real trading conditions. Factor in spreads, slippage, and execution delays that occur in live trading.
Advanced Verification Techniques
Multi-Symbol Testing
Test your EA on different currency pairs within its designed category. A robust EUR/USD EA should show consistent logic on GBP/USD or USD/CHF.
Forward Testing Validation
After backtesting, run the EA on a demo account for 2-4 weeks. This reveals how the EA performs with real-time data and execution conditions.
Statistical Analysis
Calculate the Sharpe ratio manually: (Average Return - Risk-free Rate) / Standard Deviation of Returns. Values above 1.0 indicate good risk-adjusted returns.
Red Flags That Signal EA Problems
Watch for these warning signs during backtesting:
Unrealistic Returns: Monthly returns exceeding 20-30% often indicate high-risk strategies that will eventually fail catastrophically.
Inconsistent Trade Distribution: Long periods without trades followed by excessive activity may indicate poor market adaptation.
Perfect Equity Curves: Smooth, constantly rising equity curves without drawdown periods are usually too good to be true.
Preparing for Live Trading
Before deploying your verified EA:
Start Small: Begin with minimum lot sizes regardless of backtest performance.
Monitor Closely: Track live performance against backtest expectations for the first month.
Set Stop-Loss Limits: Establish maximum account drawdown limits and stick to them.
Beyond the 5-Minute Test
While this quick verification process identifies obvious problems, thorough EA evaluation requires extended testing periods and multiple market conditions. Use this 5-minute method as your first filter, then conduct deeper analysis on promising EAs.
The goal isn't finding the perfect EA: it's avoiding the disasters and identifying systems with genuine profit potential. Master this verification process, and you'll join the minority of traders who consistently profit from automated trading systems.
Remember: backtesting shows what could have happened, not what will happen. Use these results as a foundation for informed decisions, not guaranteed predictions of future performance.